Star Candlesticks: Recognizing Trade Signals
Morning and evening stars are three-candle formations that can identify a potential change in direction. The first candle extends the preceding move, the small middle body shows reduced movement between open and close, and the third candle reverses into the first candle’s body. Recognition comes after that third candle completes.
LuxAlgo’s charting and AI platform helps you examine these formations on Quant Charts and test explicit rules with Quant, our coding agent. Use the pattern as a research signal, then define the surrounding trend, entry, stop and exit. It does not provide a guaranteed reversal or a built-in profitable trade.
Types of Star Patterns
Morning Star Pattern
A morning star is a potential bullish reversal after a decline. Its classic sequence is a long bearish body, a small lower star, then a bullish candle closing above the midpoint of the first body. That midpoint uses the first candle’s open and close, not its high and low.
Evening Star Pattern
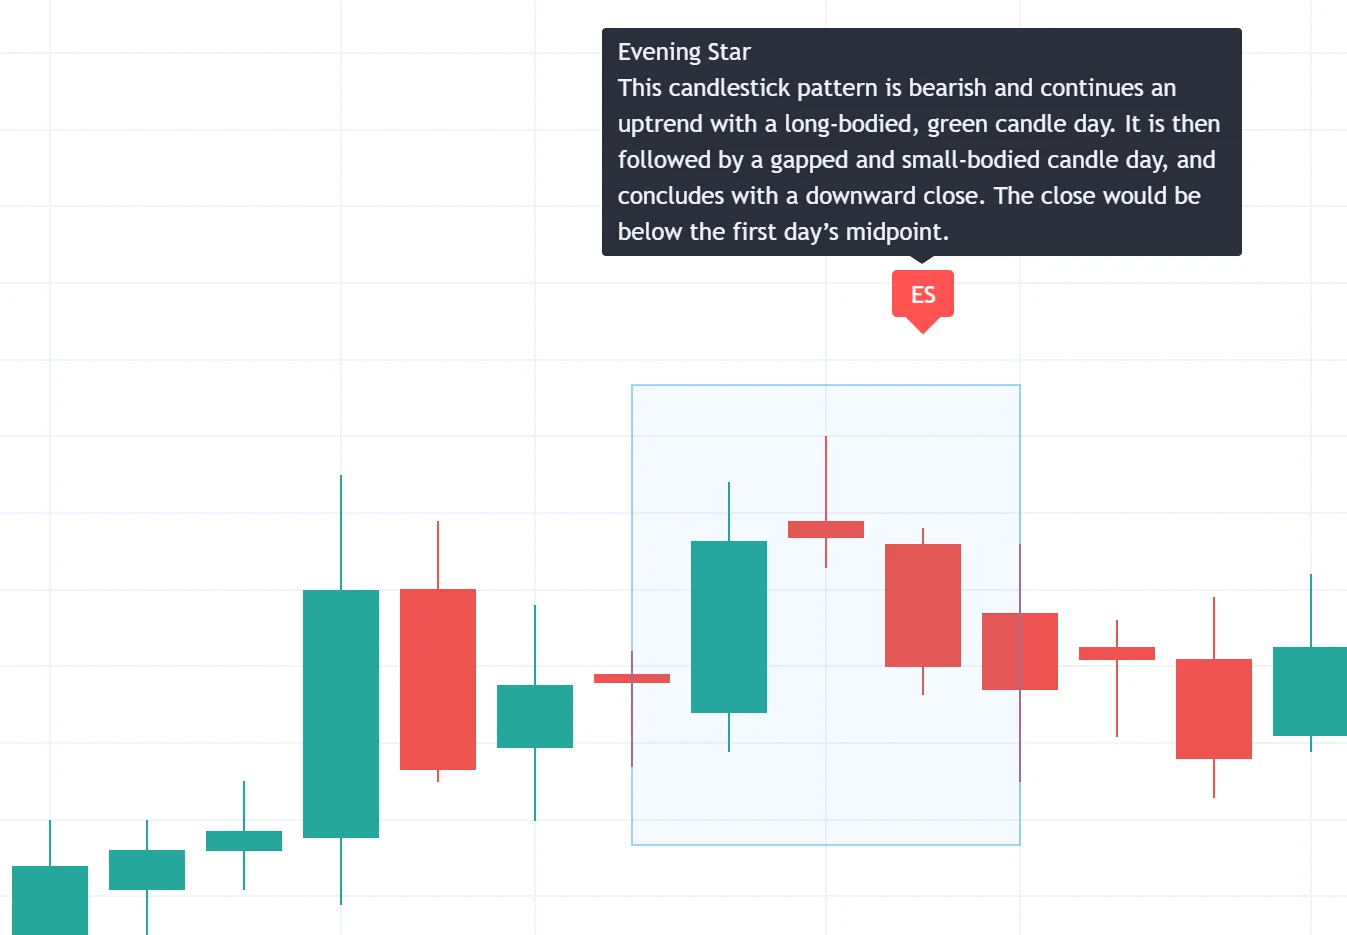
An evening star reverses the sequence after an advance: a long bullish body, a small higher star and a bearish close below the first body’s midpoint. The middle candle’s color matters less than its small body and position within the formation.
Doji Star Pattern
A doji has an open and close that are equal or very close. Morning and evening doji stars use a doji as their middle candle. An isolated doji only describes a small real body; it does not supply the surrounding trend or the third-candle confirmation.
| Formation | Context | Completion to check |
|---|---|---|
| Morning Star | A preceding decline. | Bullish third candle closes above the first body’s midpoint. |
| Evening Star | A preceding advance. | Bearish third candle closes below the first body’s midpoint. |
| Morning/Evening Doji Star | The corresponding three-candle setup with a doji in the middle. | The third candle still needs to complete the reversal condition. |
| Shooting Star | A single candle with a long upper shadow after an advance. | A different formation; do not treat it as a three-candle evening star. |
The StockCharts candlestick dictionary describes the classic daily patterns and their gap relationships. A body gap differs from a complete gap between candle ranges: shadows can overlap even when real bodies are separated.
In continuously traded markets, strict gaps may be uncommon. If you relax the gap condition for crypto, forex or intraday data, call that a modified rule and test it separately. Do not assume the results of a strict daily pattern transfer to a gapless variation.
Pattern Recognition Methods
Pattern Identification Steps
- Establish context: define the preceding trend using information available before the three-candle sequence.
- Measure the bodies: calculate the absolute difference between open and close. Define what counts as long, small and doji-sized.
- Check placement: apply your chosen gap rule consistently and distinguish the bodies from their shadows.
- Wait for completion: check the third candle’s final close relative to the first body’s midpoint.
- Review nearby levels: compare the planned entry with support, resistance and the distance available before the next obstacle.
For a hypothetical morning star, let the first candle open at $104 and close at $100. Its body midpoint is $102. A small middle candle below that body followed by a bullish third close at $103 satisfies the midpoint condition. Whether it qualifies as a complete pattern also depends on your trend, body-size and gap rules.
There is no universal 60–75% success rate for morning stars. A meaningful result requires the instrument, sample dates, definition, entry timing, exit horizon, costs and treatment of failed signals. Predicting a later price direction and earning a positive net trade return are different outcomes.
Pattern Verification Tips
Volume on the third candle can provide context, but it need not be the highest of the three for every pattern definition. Test a specified volume threshold separately. Use consistent sessions and consult Quant Charts data coverage: exchange-specific volume is not necessarily total market volume.
RSI, Stochastic, MFI and MACD can supply additional conditions. Record whether you require an oversold reading, a cross out of that region, a divergence or a signal-line crossover. These are different events and may occur on different bars. Several indicators derived from the same prices are not independent guarantees.
A higher timeframe can provide trend context while a lower timeframe controls entry, but the same three-candle pattern need not appear on both. Hourly and daily charts are possible starting points, not universally more accurate choices. Standard OHLC candles should be distinguished from synthetic candles before interpreting fills.
Using LuxAlgo Candlestick Structure
The current Candlestick Structure Library tool detects sixteen formations, including Morning Star and Evening Star, and filters them through major-trend context. Its available trend methods are Supertrend, EMAs, ChoCh and Donchian Channel. Minor-trend coloring helps visualize pullbacks within that broader structure.
This means a bullish star can be used to study the end of a short-term decline inside a larger uptrend. A classical reversal setup and a trend-aligned pullback setup are distinct hypotheses; specify which one you intend to test.
The dashboard’s alignment percentage measures how often a pattern’s appearances agreed with the selected trend direction. It is not a win rate, confidence score or forecast probability. Review individual detections and the selected trend method before relying on the display.
The Library page offers a native Quant Charts workflow and access to the original TradingView indicator. Verify the selected edition and settings; do not assume every implementation has identical defaults. A liquidation-level study is a different tool and does not automatically supply the protective stop for a star pattern.
Trading with Star Patterns
Entry and Exit Timing
| Decision | Morning Star study | Evening Star study |
|---|---|---|
| Signal timing | After the third bullish candle completes. | After the third bearish candle completes. |
| Entry assumption | For example, the next bar’s open after confirmation. | For example, the next bar’s open after confirmation. |
| Protective level | Below the formation’s low, with a defined buffer. | Above the formation’s high, with a defined buffer. |
| Target | A planned reward multiple or nearby resistance. | A planned reward multiple or nearby support. |
A pattern-height projection is one possible exit hypothesis, not an intrinsic target supplied by a star. Compare it with a reward multiple and nearby structure. If the next open gaps away from the signal close, recalculate the risk and available reward using the executable price.
Examples of Pattern Trading in Action
Brent-style short example: an assumed entry at 92.00, stop at 96.47 and target at 82.58 gives 4.47 price units of risk and 9.42 of potential reward, approximately 2.11R before costs. Treat this as arithmetic, not a verified UKBRENT trade: the exact contract or CFD, date, multiplier and execution record are required to establish results.
MFI or Stochastic leaving overbought territory and a bearish MACD crossover could be tested as additional filters for that example. Define whether they must coincide with the third candle or can occur within a fixed number of bars. Do not choose whichever timing fits a winning chart afterward.
Natural-gas example: a price decline from $8 to $6 is 25% of the starting price. It does not by itself prove a 25% account profit, an entry at $8 or a completed evening star on June 7, 2022. A futures or CFD result also depends on the contract, exposure, fills and costs. An EMA crossover can lag the move, so its actual signal timestamp matters.
Risk Control for Pattern Trading
Stop-Loss Placement
For a bullish setup, a stop below the formation’s low expresses one structural invalidation rule. For a bearish setup, the corresponding level is above its high. Include tick size, spread and a chosen buffer. Price can gap through the level, so a stop order does not ensure the planned maximum loss.
Position Size Guidelines
For a hypothetical $10,000 account, selecting 1% planned risk gives a $100 budget. An entry at $10 and stop at $9 permits 100 shares before costs. If the stop fills at $8.80, the loss is $120 before costs. A $12 target would offer 2R at the assumed $10 entry.
A 1–2% allocation is not a universal safe range, and increased confidence in a pattern does not by itself justify larger size. Choose exposure with account drawdown, correlated trades, liquidity and instrument specifications in mind. For contracts, include the value per point instead of using a share-sizing formula unchanged.
Test Star Patterns with Quant
Ask Quant, our coding agent, to make the assumptions explicit. One research specification is:
Build a daily, long-only morning-star strategy on standard candles. Define a prior decline before the first candle. Make body-size, middle-body and gap thresholds explicit inputs. Require the third bullish close above the first body’s midpoint, then enter at the next open. Allow one position, place a buffered stop below the three-candle low and test a 2R target with commission and slippage. Add a switch to compare strict gaps with a clearly labeled gapless variation.
Inspect the generated code and run it manually using Making Strategies with Quant. Check the candle indices, warm-up period, completed-bar timing and whether the script matches the intended rule rather than assuming it reproduces the Library detector.
Review fills and trade logs in the native strategy viewer. Specify what happens when a stop and target both fall within one bar’s range. Compare filters on the same sample, then evaluate periods not used to select the parameters.
| Review item | What to record |
|---|---|
| Definition | Trend, body-size thresholds, gap requirements and doji tolerance. |
| Execution | Confirmation timestamp, actual fill assumption, stop buffer and contract sizing. |
| Performance | Trade count, net expectancy, drawdown, losing streaks and exposure. |
| Robustness | Unseen periods, parameter sensitivity and results with optional filters disabled. |
Frequently Asked Questions
What is a morning star candlestick pattern?
A three-candle potential bullish reversal after a decline: a long bearish body, small middle star and bullish third close above the first body’s midpoint.
How does an evening star differ?
It follows an advance and ends with a bearish third candle closing below the midpoint of the first bullish body.
Is every doji a star reversal?
No. A doji describes a very small real body. A morning or evening doji star still needs the surrounding sequence and third-candle confirmation.
Are gaps mandatory?
Classic definitions include gap relationships. A gapless adaptation is a different rule and should be labeled and tested separately.
Does LuxAlgo’s alignment percentage show win rate?
No. It measures agreement between detected patterns and the selected trend direction, not profitable outcomes.
Does a stop below the pattern guarantee the planned loss?
No. Gaps, slippage and costs can make the actual loss larger than the entry-to-stop calculation.
References
LuxAlgo Resources
- Candlestick Structure: Patterns and Trend Alignment
- LuxAlgo Quant
- Making Strategies with Quant
- Native Strategy Backtests
- Quant Charts Data Coverage
External Resources
Read next