Volatility Strategies in Algo Trading
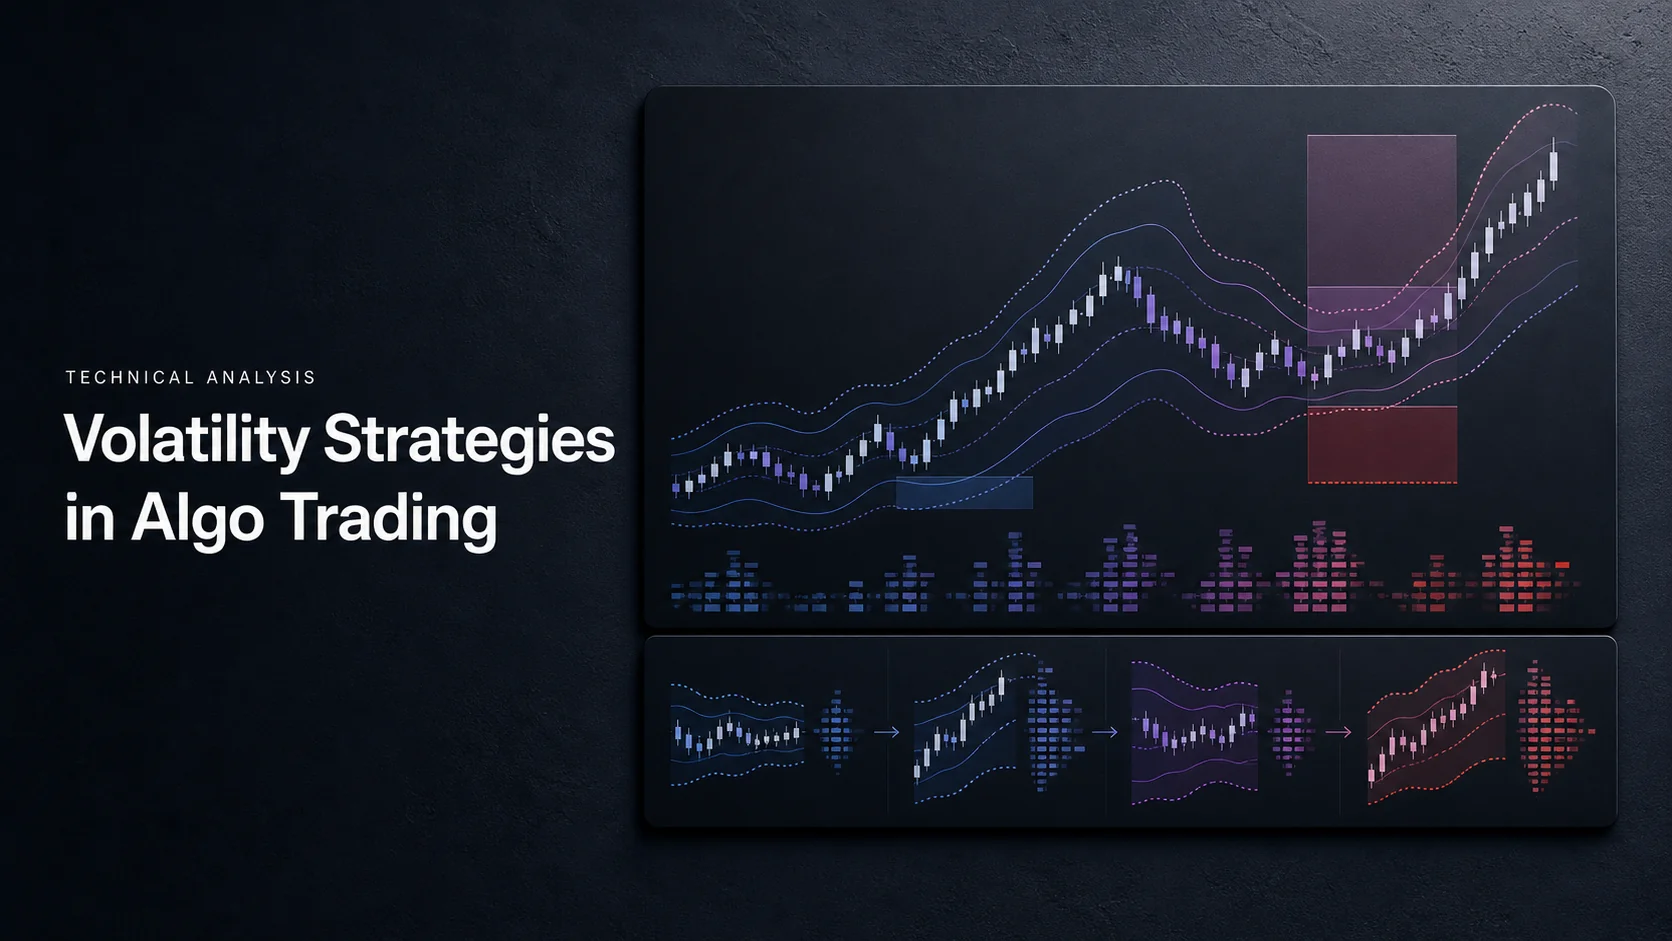
Volatility strategies use changes in price variability to select trades, size positions or manage exits. Some trade the underlying asset through trend, mean-reversion or breakout rules; others trade options and volatility derivatives. These approaches have different data, execution and risk requirements.
LuxAlgo’s charting and AI platform provides Quant Charts for examining market behavior and Quant, our coding agent, for developing inspectable strategy code. Begin with one measurable hypothesis. Faster processing and consistent rules do not guarantee an advantage after trading costs.
Main Volatility Trading Strategies
| Approach | Testable idea | Main failure mode |
|---|---|---|
| Trend following | Trade in the direction of a defined trend, sizing exposure with volatility. | Repeated reversals in a range and late exits after a sharp turn. |
| Mean reversion | Trade a defined return from an unusually large deviation toward a reference. | A persistent trend continues beyond the apparent extreme. |
| Breakout | Trade a price break following a quantified period of compression. | False breaks, gaps and execution costs. |
| Options or volatility derivatives | Trade implied volatility, realized movement or relative pricing. | Premium, convexity, decay, settlement and liquidity risks. |
Trend Following in Volatile Markets
Moving averages and MACD can define direction while ATR supplies a separate measure of price movement. For example, a study could permit longs only when the completed close is above a rising 200-day SMA, then use a shorter entry trigger. Price above an average does not necessarily mean the average itself is rising.
Ten-, fifty- and two-hundred-day averages are different lookbacks on daily data, not three chart timeframes. If you combine daily context with an hourly entry, specify when the daily value becomes available. Using the final daily close earlier in that same day creates look-ahead bias.
Claims that daily swings average a particular percentage above or below the 200-day average need a sample period and a definition of “swing.” Test the relationship on your selected data rather than treating 2.09% versus 1.05% as a permanent market rule. A long average can be a useful filter, but it cannot prevent every large loss.
Mean Reversion Trading
A mean-reversion rule assumes a defined deviation will unwind. One possible experiment waits for price to close below a lower Bollinger Band and then back inside it before considering a long entry. Buying immediately on the first band touch is a different rule.
RSI or Stochastic may add a momentum condition, but oversold does not mean price must rebound. Bands can expand while a trend continues. Define an invalidation level and maximum holding period, and avoid increasing exposure indefinitely because price looks more extreme.
Trading Volatility Breakouts
A breakout study can first identify low Bandwidth relative to its own trailing history, then require a completed close beyond a prior range. Compression alone does not predict direction. A volume or momentum filter is another hypothesis to compare, not proof of a valid break.
For a 20-bar high breakout, calculate the highest high of the previous 20 completed bars, excluding the signal bar. Including the current high can make a close-above-high condition impossible. Specify how long the compressed setup remains valid and whether only the first breakout can create a trade.
Scaling in or retaining a core position is optional. Each additional order changes total exposure and average entry. Test the simpler single-entry rule first so you can identify what the scaling rule contributes.
Using Volatility Tools in Algorithms
Separate the Measurements
| Measure | What it describes | What it does not establish |
|---|---|---|
| ATR | Smoothed true range in price units, including gaps from the previous close. | Direction, return standard deviation or a guaranteed stop distance. |
| Realized volatility | Variation in observed returns over a defined sample. | Future volatility with certainty. |
| Bollinger Bands | A price average with standard-deviation bands. | Guaranteed support/resistance or a fixed probability of containment. |
| VIX / implied volatility | Option-price-implied expectations under a specified methodology. | A directly tradable spot asset or a certain future price direction. |
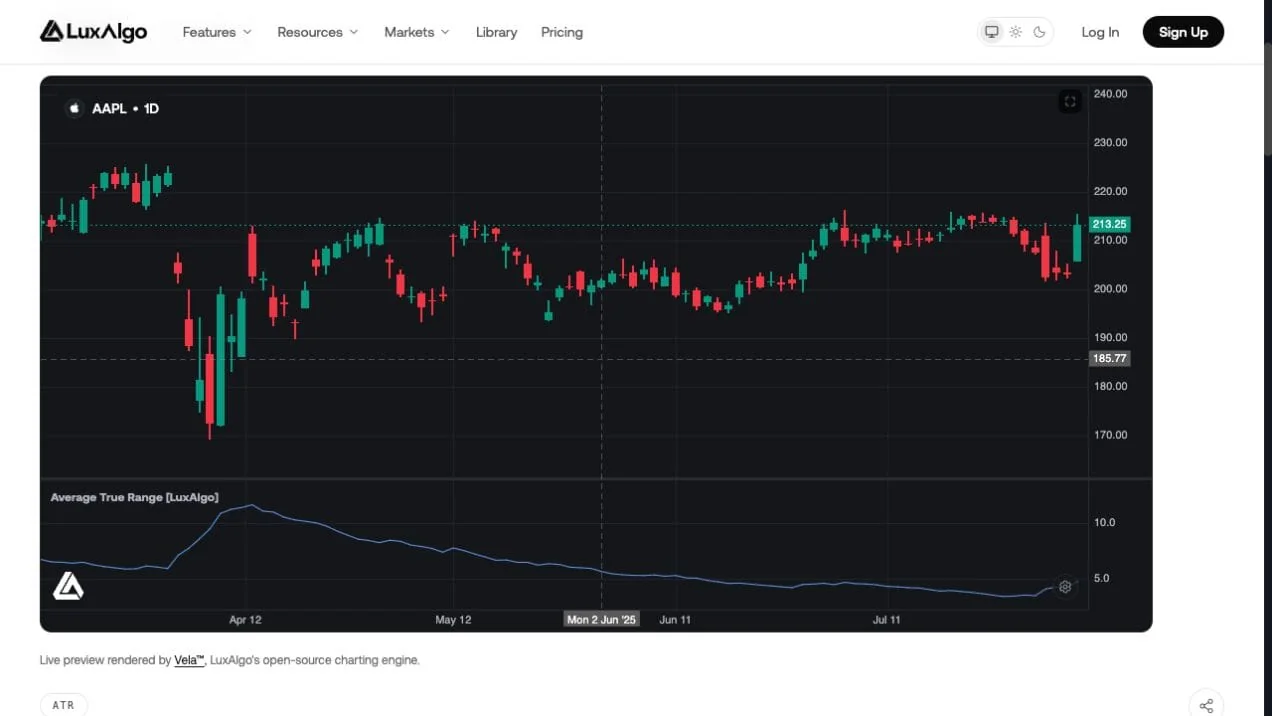
The native LuxAlgo Average True Range tool defaults to length 14 with Wilder’s RMA smoothing; SMA, EMA and WMA are alternatives. True range is the largest of high minus low, the absolute distance from high to previous close, and the absolute distance from low to previous close.
For a bar with high $105, low $102 and previous close $100, true range is $5, not the $3 high-low span. ATR then smooths those observations. An ATR of $2 on a $20 stock is not the same relative movement as $2 on a $200 stock.
LuxAlgo Bollinger Bands defaults to a 20-period SMA, close source and a two-standard-deviation multiplier. Display modes include Bands, %B and Bandwidth. Bandwidth measures separation relative to the basis; %B describes position within the bands. A close outside a band can accompany continuation.
Keltner Channels commonly use an ATR-based envelope, whereas Donchian Channels use lookback highs and lows. Record the implementation, source and current-bar treatment before comparing their signals. Similar-looking channels do not imply identical calculations.
Cboe describes VIX as an option-implied measure of expected S&P 500 volatility. Its 30-day horizon is expressed on an annualized basis. It is distinct from a stock’s ATR or a realized return-volatility estimate. VIX futures and options have their own pricing and settlement characteristics; they do not simply reproduce changes in the spot index.
Risk Controls for Volatile Markets
Define a risk budget before calculating size. With a hypothetical $250 budget, ATR of $2 and an initial stop two ATR away, risk is $4 per share: 62 whole shares imply $248 before costs. If ATR is $4, the same two-ATR distance is $8 and 31 shares imply $248.
That calculation normalizes planned entry-to-stop exposure, not every possible loss. Gaps and liquidity can produce worse fills. Do not automatically widen an existing stop whenever ATR rises; that can increase risk after entry. If using an ATR trailing stop, explicitly define whether it can only tighten and when ATR is sampled.
Portfolio checks should include correlated positions, gross exposure, leverage and concentrations. Several low-volatility positions can share the same shock. Reducing size may help meet a budget, but diversification is not a guaranteed hedge.
Testing Volatility Strategies with Quant
Ask Quant, our coding agent, to implement one defined experiment. For example:
Build a long-only daily breakout strategy on standard candles. Mark compression when Bollinger Bandwidth is below its trailing 100-bar twentieth percentile. Allow a signal within five bars of compression when the completed close exceeds the previous 20 bars’ highest high, excluding the current bar. Enter at the next open, allow one position, freeze signal-bar ATR(14), set an initial two-ATR stop and a 2R target, and include commission and slippage inputs.
Inspect the generated code and run it manually, following Making Strategies with Quant. Verify percentile calculations, warm-up history, setup expiry, next-open entries and stop/target precedence. This prompt is a research specification, not a tested profitable strategy.
Use the native strategy viewer to inspect fills, sizing and trade logs. Commission and slippage assumptions do not constitute a full simulation of order-book queues, market impact or exchange latency.
Review data coverage, timestamps, missing bars and session definitions. Evaluate calm, trending, choppy and stressed periods with parameters fixed before each evaluation window. Report trade count, drawdown, net expectancy, turnover and exposure, not just win rate.
Alpha and beta depend on the benchmark and estimation method; R-squared describes fit rather than profitability. Sharpe ratios can obscure asymmetric or tail losses. Use these alongside the trade distribution and stress scenarios instead of treating one metric as proof of robustness.
Advanced Volatility Trading Methods
ML-Based Volatility Forecasting
Machine learning can estimate future volatility from lagged returns, realized measures and market features. Compare it against simple baselines and appropriate models such as HAR or GARCH. More features or a complex model does not establish better unseen performance.
A claim that a model with 147 features and 21 lags beats HAR in 90% of periods needs the original dataset, forecast horizon, loss function and evaluation protocol. Without those details, it should not guide model selection. Forecast accuracy and profitable execution are also separate questions.
Use chronological training and evaluation, fit transformations only on training data, and prevent overlapping forecast targets from leaking across the split. Include stressed periods and retraining costs. SHAP values describe contributions to a model’s prediction; they do not prove that bid, ask or midpoint features cause future volatility.
Speed Trading in Volatile Markets
High-frequency strategies depend on exchange access, latency, queue position and detailed execution logic. Volatility can increase both opportunity and adverse selection. A faster system can also multiply errors more quickly.
Hardware, networking and direct access require specialized infrastructure and controls. A daily or intraday candle backtest cannot demonstrate a microsecond execution advantage. Keep chart-based strategy research separate from claims about a production high-frequency system.
Cross-Asset Volatility Trading
A June 2023 interview with the Danske Invest GCAV managers described a typical 70% systematic and 30% tactical mix and a Sharpe-ratio target of 0.5. Those were historical descriptions and a target, not a current allocation or guaranteed return.
The interview describes volatility strategies across equities, interest rates and currencies, mostly within individual asset classes. It explicitly says trades between asset classes were occasional rather than central. The example illustrates diversification of implementation, not a claim that every cross-asset fund primarily trades intermarket pairs.
| Analysis | Useful question | Important limitation |
|---|---|---|
| Volatility surface | How does implied volatility vary across strikes and expiries? | Apparent differences may reflect skew, liquidity and contract terms. |
| Term structure | How do prices or implied volatilities differ by maturity? | A maturity curve is not simply historical volatility changing through time. |
| Correlation and stress analysis | Which exposures can lose together? | Historical correlations can change during shocks. |
Options require separate premium and payoff analysis. A long straddle can lose despite a large move if the premium was expensive or implied volatility falls. An iron condor can suffer a large loss when price leaves its range. Include decay, convexity, assignment where relevant, spreads and settlement; “high volatility” or “range-bound” alone is not enough to choose either.
Risks and Ethics
Handling Market Shocks
The SEC’s Knight Capital findings describe more than four million orders in the first 45 minutes of August 1, 2012, following code and deployment failures. The firm eventually lost more than $460 million. This was an operational-control failure, not merely an unusually volatile price move.
Use pre-trade limits, order-size checks, duplicate-order protection and reconciliation between intended orders and actual positions. An internal loss limit differs from an exchange circuit breaker. A kill switch may stop new orders without closing existing exposure, so define the incident procedure.
Failover systems also need testing: two systems simultaneously believing they are primary can duplicate trades. Rehearse stale-data handling, rejected orders, connection loss and recovery using reconciled broker state. Backups alone do not guarantee safe continuity.
Following Trading Rules and Monitoring Impact
Maintain audit trails for strategy versions, data, parameter changes and orders. Use licensed data and follow the applicable venue and jurisdiction requirements. Controls should detect potentially manipulative behavior such as spoofing, layering and wash trading rather than assuming automation makes every order acceptable.
Match order size and execution pace to available liquidity. Review cybersecurity, access controls and market impact alongside strategy performance. These operational concerns belong in deployment planning even when a research backtest looks strong.
Implementation Steps
- Choose one volatility measurement and one trade hypothesis.
- Define the feed, session, interval, entry and exit timing.
- Set exposure and operational limits before testing.
- Inspect and manually run the strategy, accounting for realistic costs.
- Evaluate unseen and stressed periods, including conditions resembling the 2020 volatility shock.
- Review failures and execution differences before considering deployment through an appropriate trading system.
Bollinger Bands and RSI: Additional Tutorial
This supplemental tutorial discusses the indicator pairing. Use it alongside explicit rules and testing; pairing two indicators does not make signals reliable by itself.
Frequently Asked Questions
Does higher volatility tell an algorithm which direction to trade?
No. Volatility describes variability. A direction requires a separate trend, breakout or other rule.
Is ATR the same as implied volatility?
No. ATR smooths historical true ranges in price units. Implied volatility is inferred from option prices under a pricing methodology.
Does a Bollinger Band touch guarantee mean reversion?
No. Price can remain near or outside a band during a persistent trend.
Should a stop widen automatically when ATR rises?
Not without an explicit risk rule. Widening an existing stop can increase exposure after entry.
Does Quant automatically run and deploy generated strategies?
Inspect the generated code and run it manually. A chart backtest does not establish live execution or high-frequency infrastructure.
Can a long straddle lose in a volatile market?
Yes. Premium, realized movement, implied-volatility changes, time decay and costs all affect the result.
References
LuxAlgo Resources
- Average True Range Library Tool
- Bollinger Bands Library Tool
- LuxAlgo Quant
- Making Strategies with Quant
- Native Strategy Backtests
- Quant Charts Data Coverage
External Resources
Read next