How to Backtest Trading Strategies Using AI

Backtesting with AI transforms how traders test strategies by automating repetitive work, analyzing large strategy sets, and simulating market conditions with more consistency than manual testing alone.
- What is backtesting? Testing trading strategies on historical data to evaluate how they would have performed before risking capital.
- Why use AI? AI speeds up testing, helps optimize parameters, reduces manual errors, and can account for realistic inputs like fees, slippage, and market regime differences.
- LuxAlgo resources: LuxAlgo provides AI-assisted strategy research on TradingView and through its AI Backtesting Assistant, which helps traders search, compare, and deploy strategies more efficiently.
- Key steps:
- Use accurate historical data.
- Simulate realistic conditions, including fees and slippage.
- Define clear entry, exit, and risk rules.
- Automate strategy research and refinement with AI where appropriate.
- Analyze metrics like win rate, drawdown, and profit factor.
AI-driven backtesting can save time, improve consistency, and help refine strategies for different markets and conditions. For traders who want to move from an idea to an executable TradingView script faster, LuxAlgo Quant can also help generate, validate, and refine Pine Script strategies before they are tested.
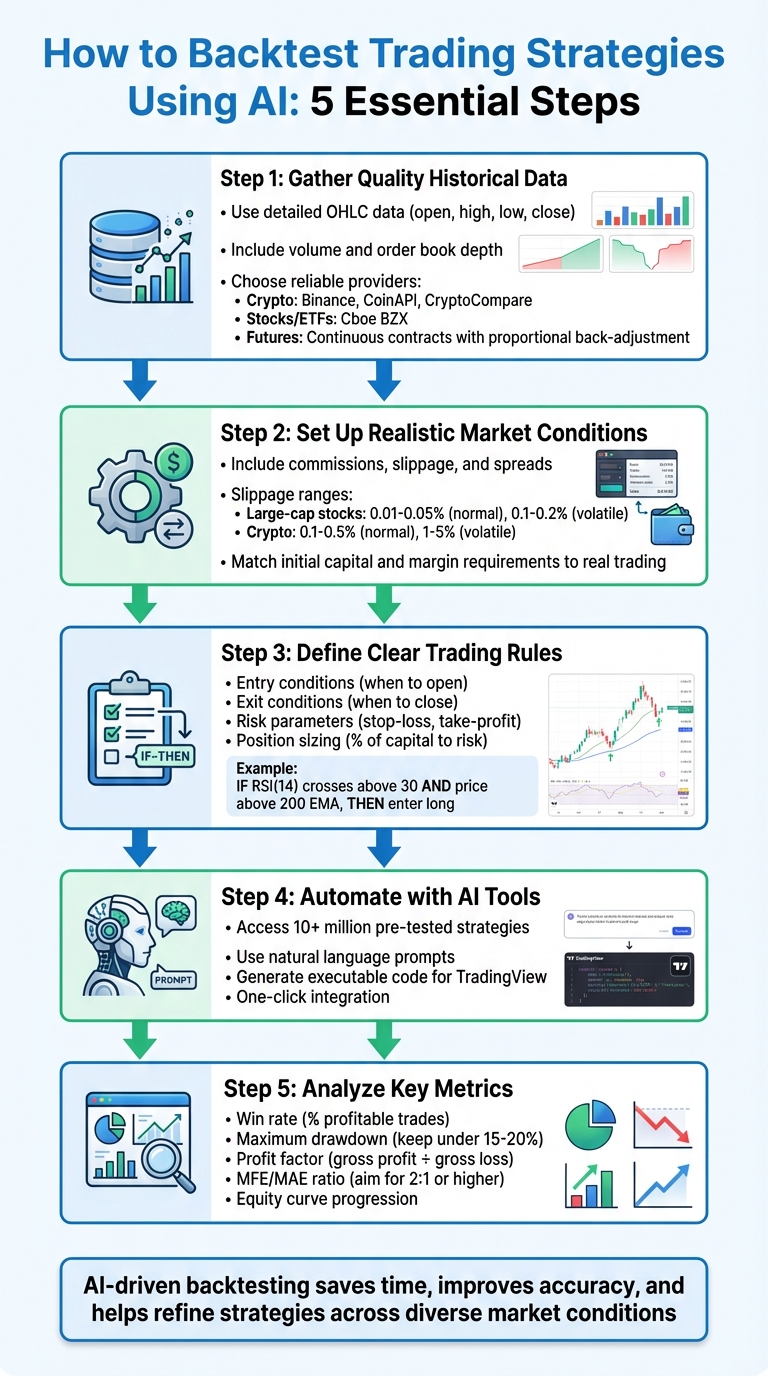
5-Step AI Backtesting Process for Trading Strategies
Setting Up Your Backtesting Environment
Selecting Quality Historical Data
The accuracy of your backtesting results hinges on the quality of your historical data. Start with detailed OHLC data (open, high, low, close), along with volume and, when relevant, order book depth. These inputs are useful for identifying precise patterns, evaluating execution assumptions, and understanding whether a strategy depends on liquidity conditions that may not be obvious from candles alone.
When sourcing data, stick to reliable providers suited to your asset class. For cryptocurrency, platforms like Binance, CoinAPI, and CryptoCompare are common choices. For U.S. stocks and ETFs, consolidated exchange-quality data is preferable to incomplete broker feeds. If you're working with futures strategies, opt for continuous contracts with proportional back-adjustment to reduce artificial price gaps caused by contract rollovers.
"The performance of any AI crypto trading bot is only as good as the data it was trained and tested on." - Dwight Sproull, Former Content Lead, 3Commas [8]
Timeliness of data is just as important as its accuracy. Outdated or incomplete data can introduce distortions that skew results, especially in fast-moving markets. Cross-check recent trades in your logs against actual chart markers to ensure everything aligns, because even small mismatches in timestamps, session boundaries, or adjusted prices can affect the validity of an entire test.
Once you’ve secured accurate and timely data, the next step is to simulate the real-world trading environment as closely as possible.
Setting Up Realistic Market Conditions
Real-world trading comes with challenges that simple backtests can miss. Factors like commissions, slippage, and spreads can turn a seemingly profitable strategy into a losing one. To avoid this, include these market frictions in your tests. For instance, simulate slippage based on the asset class, market conditions, and execution style. Large-cap equities may experience relatively small slippage in calm conditions, while thinly traded crypto pairs or volatile news sessions can produce materially worse fills.
Additionally, set your initial capital, leverage, and margin requirements to match real trading conditions. If your broker applies different requirements for long and short positions, or your venue charges different fees for makers and takers, reflect that in your backtest. These adjustments keep results grounded in reality and reduce the risk of drawing over-optimistic conclusions from frictionless simulations.
Using LuxAlgo for Backtesting Setup
After accounting for market frictions, LuxAlgo provides several ways to simplify and enhance your backtesting workflow. Its AI Backtesting Assistant helps traders search and compare strategy ideas more efficiently, while the TradingView backtesters make it easier to adjust settings such as testing windows, entries, exits, and risk controls. Once you’ve identified a promising strategy, you can move it into TradingView and inspect all entry, exit, and risk logic directly on the chart.
LuxAlgo’s Backtesters for TradingView let you manually adjust important variables like order size, commission rates, and testing windows. That matters because realistic testing depends on entering your broker’s actual fee assumptions rather than relying on default settings. To get a broader perspective, test across multiple market phases instead of evaluating only a narrow sample of recent bars. This makes it easier to see how a strategy behaves in trending, ranging, and volatile conditions.
If your process includes building or modifying Pine Script strategies, Quant is especially relevant here. LuxAlgo Quant is an AI coding agent specialized in Pine Script for TradingView, so traders can use it to translate a strategy idea into code, validate logic, and debug implementation issues before running deeper backtests.
With these resources, you can automate much of the setup and research process, freeing up more time to focus on interpreting results and improving execution quality.
Building and Automating Trading Strategies
Defining Clear Trading Rules
Backtesting thrives on rules that are both clear and actionable. Your rules should be specific enough that a computer can follow them without ambiguity. For example: "If RSI(14) crosses above 30 and price is above the 200 EMA, then enter long" is explicit and much more testable than a vague statement like "buy when momentum improves."
Every trading rule should cover four key elements: entry conditions (when to open a trade), exit conditions (when to close it), risk parameters (such as stop-loss and take-profit levels), and position sizing (how much capital to risk). A more complete example would be: "Go long when RSI(14) crosses above 30 and price is above the 200 EMA. Set the stop-loss at 1.5x ATR(14) below entry, set take-profit at 3x ATR(14) above entry, and risk no more than 1% of equity per trade." This level of precision makes your test repeatable and comparable over time.
Automating Strategies with AI
Platforms like LuxAlgo simplify automation by turning plain-language strategy descriptions into structured workflows for research and deployment. With the AI Backtesting Assistant, traders can search for and compare strategy concepts using natural language prompts, then export ideas into TradingView for deeper analysis. That can significantly shorten the time between a concept and a working test.
For traders who want to go further into strategy creation, LuxAlgo Quant is useful for building and refining Pine Script logic directly. Instead of manually coding every condition, traders can use Quant to generate indicators or strategies from natural language prompts, validate syntax and logic, and iterate on scripts more quickly. This is particularly helpful when converting discretionary chart ideas into consistent, testable TradingView rules.
LuxAlgo also supports more advanced rule building through structured conditions and backtesting workflows. That makes it easier to define triggers, filters, and invalidation rules so a strategy is not relying on a single simplistic signal. Clear sequencing and confirmation logic can reduce false entries and make the resulting backtest more representative of how the system would be traded live.
Examples of AI-Driven Strategy Rules
Take Break of Structure (BoS) as an example. This trend-following concept can trigger entries when price confirms a new high or low. A simple rule might be: "If price breaks above the most recent swing high and volume is above average, then enter long with a stop-loss below the broken structure and a take-profit at a 2:1 reward-to-risk ratio." This kind of logic helps traders identify and automate trades that align with directional momentum.
On the other hand, Change of Character (CHoCH) focuses on momentum shifts. A rule could be: "If price fails to hold a previous low after a strong directional move, then look for reversal confirmation with trend or moving-average context." Traders can test this idea across different sessions and volatility conditions to determine whether it performs better as a reversal setup, a trend continuation filter, or a condition that should only be used during specific market windows.
When these ideas need to be implemented in TradingView, Quant can help turn BoS, CHoCH, or other price action concepts into Pine Script without forcing traders to build every line from scratch. That makes it easier to prototype multiple rule variations, compare them in the Strategy Tester, and refine the logic based on actual performance data rather than assumptions.
Running Backtests and Analyzing Results
Starting and Monitoring Backtests
To kick off a backtest in TradingView, open the Strategy Tester, choose your symbol and date range, and make sure your execution assumptions match the way you intend to trade. As the test runs, monitor the Performance Summary and List of Trades tabs rather than focusing only on net profit. Reviewing trades one by one can reveal whether gains are concentrated in only a few outlier moves or whether the strategy behaves consistently across different phases of the market.
If you’re using the AI Backtesting Assistant, you can also move from prompt-based strategy discovery into chart-level review more quickly. Once the backtest is underway, the focus should shift from finding a promising idea to understanding whether the idea is actually robust.
Key Performance Metrics to Track
While your backtest is running, it’s crucial to monitor the metrics that reveal how well your strategy is performing. Some of the most important ones include:
- Win rate: Reflects how often your trades are profitable.
- Maximum drawdown: Shows the largest peak-to-trough decline, which is a core measure of risk.
- Equity curve progression: A steadier equity curve is often more useful than one that depends on a few outsized trades.
- Profit factor: Compares gross profit to gross loss and helps evaluate whether the strategy has a meaningful edge.
- Expectancy: Measures the average value per trade, which can be more informative than win rate alone.
For example, a strategy with a 55% win rate, manageable drawdown, and a smooth equity curve is generally more durable than one with a higher win rate but erratic performance. Many traders also monitor whether performance remains stable after costs, because a strategy that looks strong before commissions and slippage may weaken materially once realistic execution is applied.
Other useful metrics include MAE (Maximum Adverse Excursion) and MFE (Maximum Favorable Excursion). MAE tracks the worst unrealized loss per trade, while MFE measures the best unrealized gain. Together, they can show whether your stops are too tight, whether targets are too conservative, or whether a setup needs better filtering before entry.
Once you’ve analyzed these metrics, export the data for deeper review rather than relying only on the summary panel.
Exporting and Reviewing Test Data
After completing your backtest, export the trade data from the List of Trades tab as a CSV file. That file contains important details like entry and exit prices, timestamps, profit and loss, and trade-by-trade performance that are easier to inspect outside the chart.
Open the CSV in Excel or another spreadsheet application for further analysis. For example, sorting trades by drawdown can reveal whether certain setups repeatedly underperform, while filtering by session can show whether a system is stronger during the London or New York open than during quieter hours. This kind of review often highlights practical improvements that are easy to miss in aggregate statistics.
This step complements your earlier risk analysis and provides a fuller picture of how the strategy behaves. It is also a good time to revisit your stop-loss logic, position sizing assumptions, and session filters. By thoroughly reviewing the exported data, you can identify areas for improvement and fine-tune your strategy with much more confidence.
Improving and Optimizing Your Strategies
Iterative Testing and Walk-Forward Validation
Once you’ve reviewed your backtest results, the next step is refining your strategy through repeated testing and controlled iteration. Start broad by generating or selecting an initial concept, then tighten the rules and constraints based on what the results reveal. Instead of making sweeping changes all at once, adjust one part of the system at a time so you can measure what actually improved performance.
Walk-forward analysis builds on this by testing your strategy across rolling windows of market data. Rather than optimizing on one fixed sample, you repeatedly validate the strategy on out-of-sample data to reduce the risk of overfitting. This helps confirm whether the system can remain effective across changing market conditions instead of only performing well in one historical regime.
Testing Strategies Across Different Market Conditions
A strategy that thrives in trending markets may struggle in sideways or highly erratic conditions. To address this, test the strategy across different market environments, sessions, and asset classes. Compare how it performs during strong directional moves versus low-volatility consolidation, and during active market opens versus slower periods.
If you notice performance dropping during specific sessions or volatility regimes, consider adding filters rather than abandoning the concept entirely. Using a primary trigger together with one or two higher-level filters can often improve selectivity and reduce poor trades without making the system overly complex. The goal is not to create a perfect historical curve, but to build a strategy that remains sensible across varied conditions.
Advanced AI Optimization Methods
AI-powered tools can take strategy development further by accelerating search, comparison, and refinement. LuxAlgo’s AI Backtesting Assistant helps surface strategies that match your preferred concepts and risk profile faster than manual iteration alone. That can uncover combinations and filters you may not have tested on your own.
For strategy development on TradingView, Quant is also valuable at this stage. Traders can use LuxAlgo Quant to generate Pine Script variations, debug logic, and validate whether a change in conditions or risk management has been implemented correctly. This reduces coding friction and shortens the path from analysis to a deployable TradingView strategy.
To reduce overfitting, split your work into separate design, validation, and review stages, and stress-test your ideas across multiple market conditions before deploying them. Once you have a strategy that holds up in those checks, validate it through paper trading in live market conditions so you can assess execution quality and behavioral consistency before committing real capital.
Conclusion
Key Takeaways
AI-driven backtesting has changed how traders develop and refine strategies. Instead of manually testing every idea, traders can now use AI-assisted workflows to search for setups, compare rule variations, and move more quickly from research to validation. LuxAlgo’s AI Backtesting Assistant helps streamline that process by making strategy discovery and comparison more efficient.
These workflows make it easier to base decisions on data rather than intuition alone. Once the strategy logic is clear, realistic backtests, session-based analysis, and walk-forward validation can help traders determine whether the edge is durable or simply a result of curve fitting. That same process can then be strengthened with better implementation, especially when Pine Script logic is involved.
For traders who want to prototype and refine TradingView strategies faster, Quant adds another layer of speed and precision by helping turn trading ideas into testable Pine Script indicators and strategies. Together, these resources support a more structured path from concept to live-market preparation.
Next Steps for Traders
Now that you’ve explored backtesting and analysis, the next step is to put the process into practice. Start with reliable historical data, define clear trading rules, and run a realistic backtest with costs and execution assumptions included. Then refine the strategy using drawdown, expectancy, profit factor, and trade distribution rather than relying on win rate alone.
If you want help generating or refining code for TradingView, use LuxAlgo Quant to turn strategy ideas into Pine Script, validate the implementation, and reduce manual debugging time. If your goal is broader AI-assisted strategy discovery and testing, explore the AI Backtesting Assistant documentation to move from prompts to structured testing workflows. This step-by-step approach helps traders build strategies that are more realistic, testable, and ready for live validation.
Backtest Any Trading Idea Using AI Agentic Skills - No Coding Needed
FAQs
How do I avoid overfitting when using AI backtests?
To avoid overfitting in AI backtests, keep your model logic as simple as possible while still reflecting your edge. Validate strategies on out-of-sample data, test them across different market regimes, and avoid excessive parameter tuning. It also helps to use walk-forward validation, realistic trading costs, and data that would actually have been available at the time of the trade so you do not introduce look-ahead bias.
What fees and slippage should I include in my backtest?
When you're backtesting trading strategies with AI, include all meaningful execution costs. That typically means exchange or broker commissions, spreads, funding or borrowing costs where relevant, and slippage assumptions that reflect the liquidity of the market you trade. In very liquid markets, slippage can be modest, but in fast or thin markets it can materially change performance. Including these costs makes the backtest much more representative of real trading.
Which metrics matter most beyond win rate?
To evaluate trading strategies effectively, it’s important to look beyond win rate. Metrics like maximum drawdown, profit factor, expectancy, and risk-adjusted returns often reveal much more about whether a strategy is durable. Reviewing the equity curve and trade distribution can also show whether performance is consistent or dependent on only a few trades.
References
LuxAlgo Resources
- LuxAlgo
- AI Backtesting Assistant
- AI Backtesting Assistant Documentation
- LuxAlgo Quant
- Quant Documentation
- LuxAlgo Library
External Resources
Read next