
Step-by-step guide to learn algorithmic trading: Python basics, backtesting, tools, and moving from paper to live trading.
Want to trade like the pros? Algorithmic trading can help you execute trades faster, more consistently, and with less emotional interference. Here's how you can go from a beginner to an algorithmic trader:
- Learn the Basics: Understand trading principles, market dynamics, execution quality, and risk management. You do not need a computer science degree, but a solid trading foundation matters.
- Start Coding: Python is one of the most popular languages for algorithmic trading. It offers libraries like Pandas (data analysis), NumPy (numerical calculations), and Backtrader (backtesting).
- Test Strategies: Backtest your ideas using historical data to refine strategies before risking real capital. This process often includes stress testing trading strategies so you can see how a system behaves during adverse conditions.
- Choose the Right Platform: Platforms like LuxAlgo and TradingView can simplify strategy research, chart analysis, automation workflows, and AI Backtesting.
- Go Live Carefully: Transition to live trading with small positions, monitor slippage and execution, and adjust based on actual results instead of assumptions.
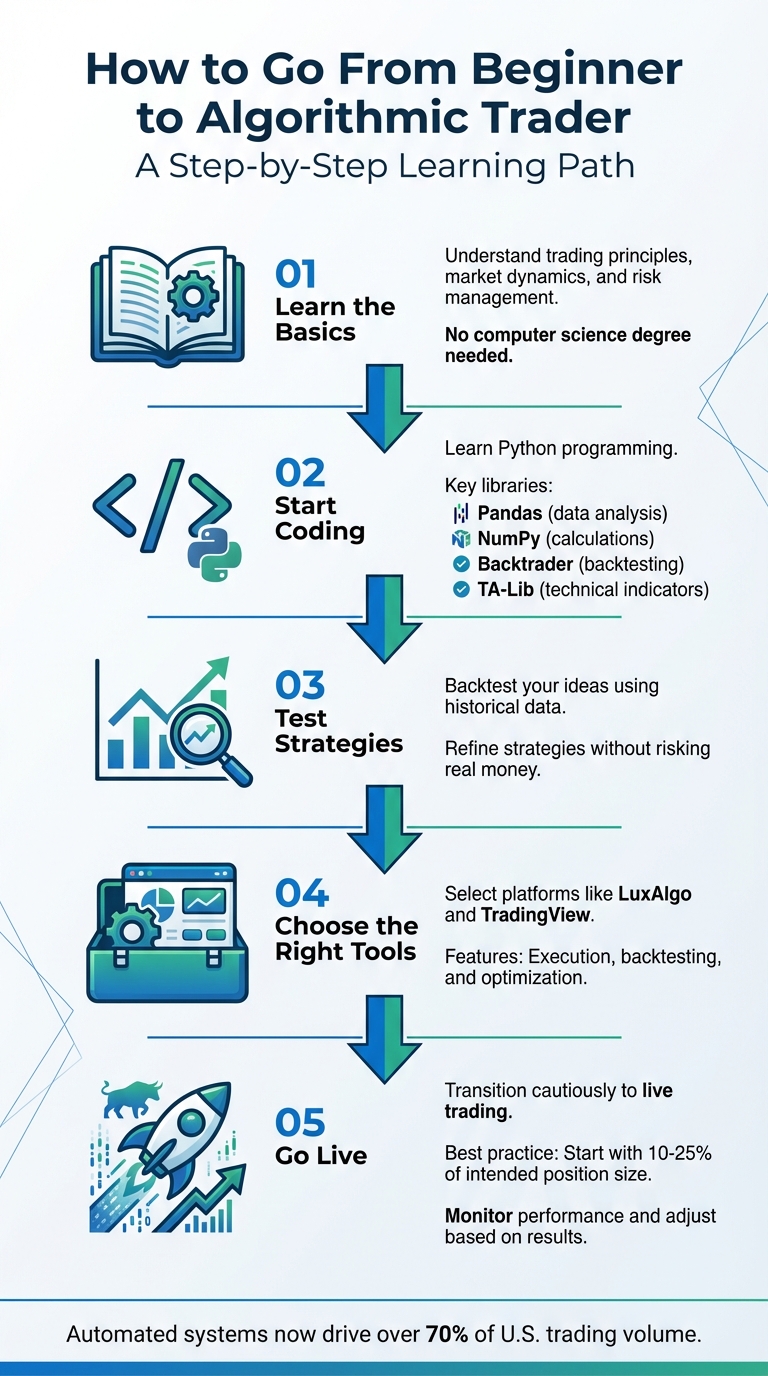
5-Step Path from Beginner to Algorithmic Trader
Algorithmic Trading Python for Beginners - Full Tutorial
Learning Programming Basics for Trading
Coding is a major advantage in algorithmic trading because it lets you turn trading ideas into rules that can be tested, repeated, and improved. Without programming knowledge, you are often limited to pre-built systems that may not fit your market, timeframe, or risk profile. By learning to code, you can define custom entry and exit logic, position sizing, and risk controls that execute consistently. That flexibility is one of the biggest differences between discretionary trading and systematic trading.
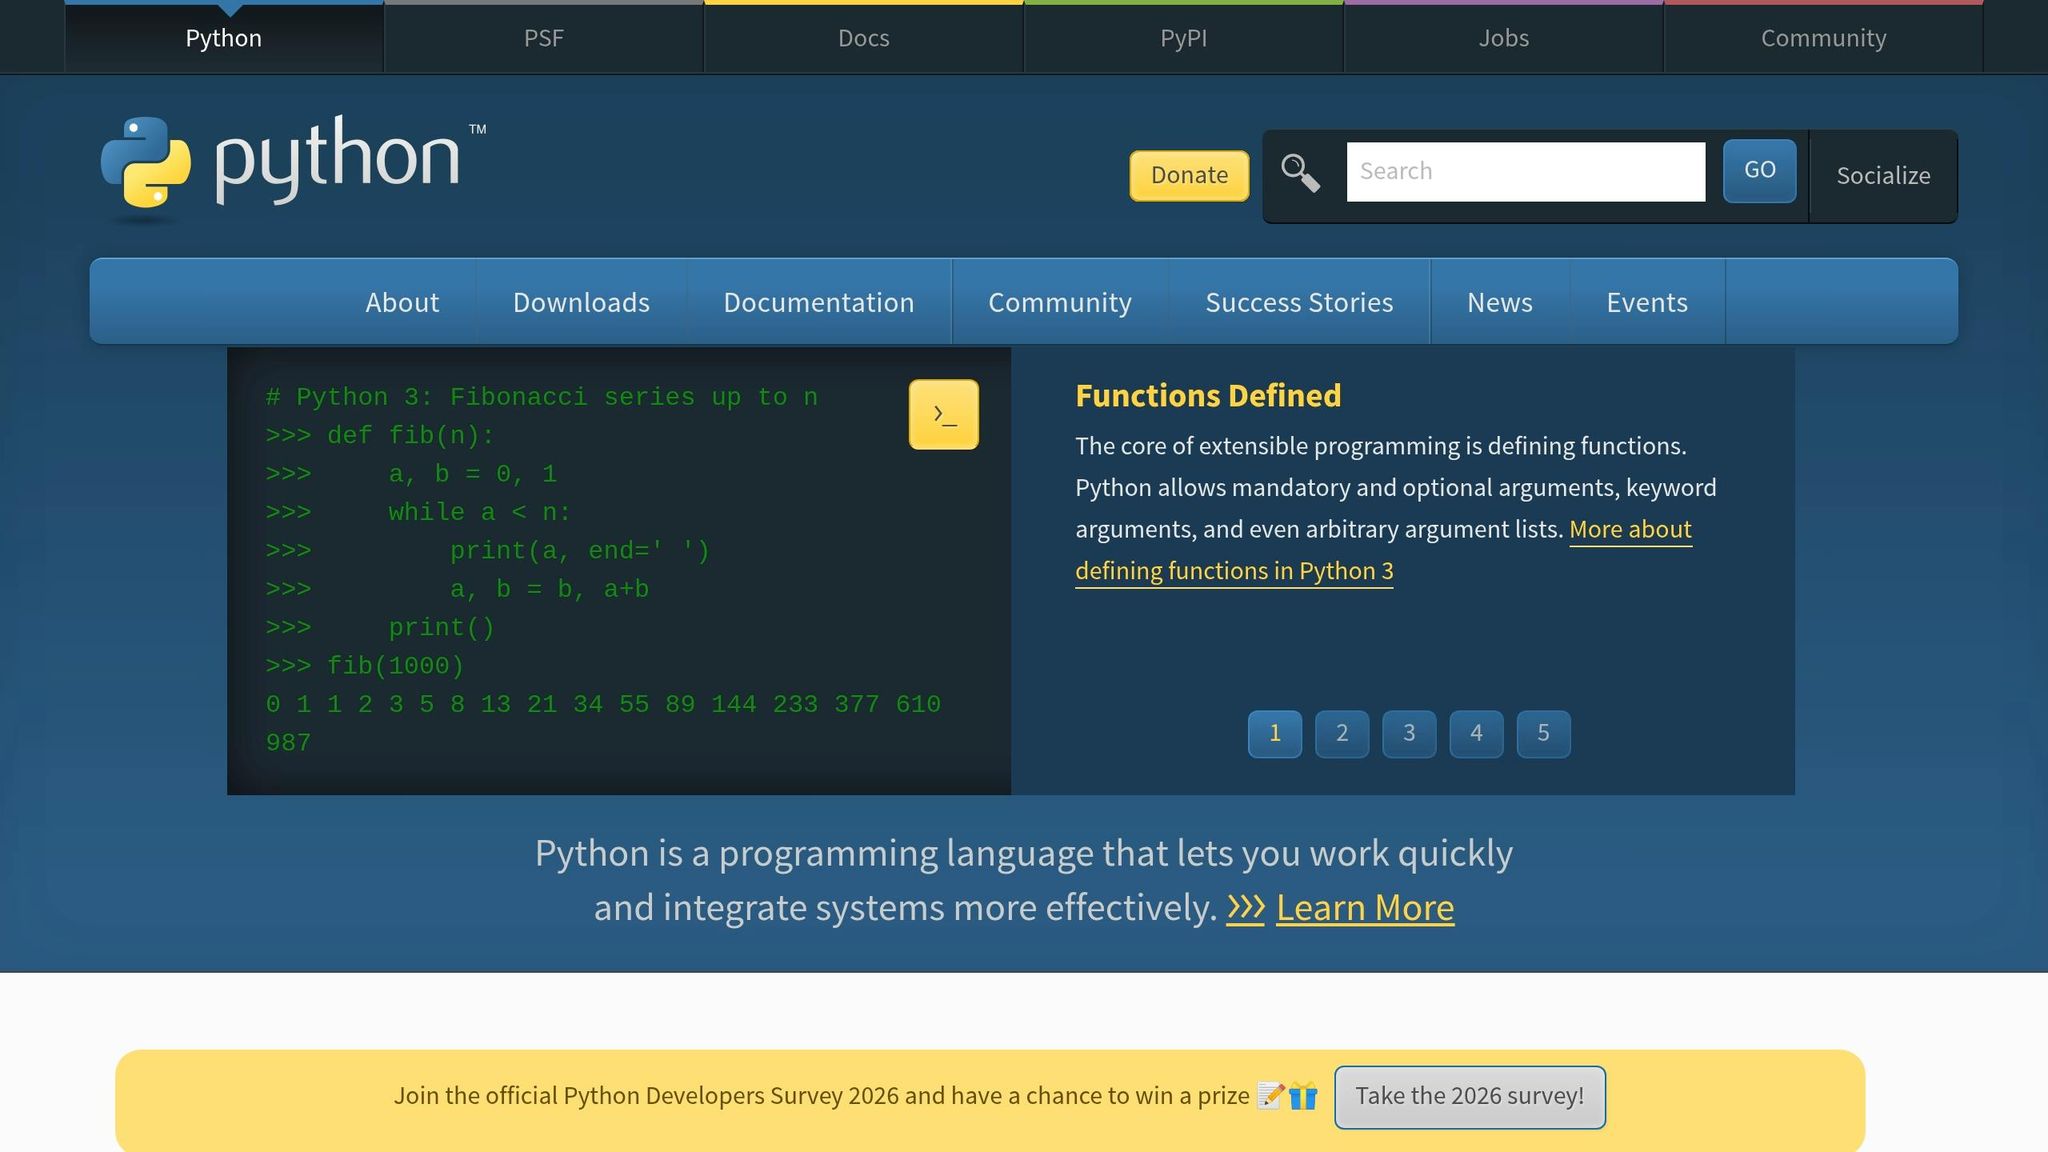
Why Use Python for Trading?
Python remains a popular starting point for algorithmic trading because of its readable syntax and broad ecosystem for finance workflows. With Python, traders can download historical data, calculate indicators, evaluate performance, and prototype rule-based systems without writing overly complex code.
What makes Python especially practical is the range of specialized libraries available:
- Pandas simplifies working with time-series data, making it easier to analyze price histories and compute returns.
- NumPy handles fast numerical computations, which is useful when processing large datasets.
- TA-Lib provides ready-made technical indicators like RSI, MACD, and Bollinger Bands, so you do not have to code them from scratch.
- Backtrader helps traders test strategies on historical data before moving to paper trading or live execution.
For traders building on TradingView, Python is not the only path. TradingView uses Pine Script for indicators and strategies, and this is where LuxAlgo Quant becomes especially relevant. Quant is an AI coding agent specialized in Pine Script for TradingView, so traders can turn plain-language ideas into indicators and strategies faster, validate logic, and fix coding issues without starting from a blank editor.
These options make it easier to move from a trading idea to a testable system.
Core Python Skills You Need
To get started, you should understand basic programming concepts. Loops help you process price data over time, conditionals define entry and exit rules, and functions let you organize logic into reusable modules. As strategies become more sophisticated, clean code structure becomes just as important as the trading logic itself.
Handling data is another critical skill. You will need to clean datasets, deal with missing values, calculate indicators like moving averages or RSI, and measure performance with metrics such as drawdown, profit factor, and Sharpe Ratio. Using vectorized operations in Pandas and NumPy can greatly improve speed when working with larger datasets. For risk management, traders often add stop-loss logic, exposure limits, and position sizing rules such as risking a fixed fraction of capital per trade.
If your goal is to build scripts for TradingView instead of a Python-only workflow, Quant’s documentation is useful for understanding how to prompt an AI specialized in Pine Script generation, validation, debugging, and chart-to-code workflows.
Here’s a quick look at some useful Python libraries:
| Library Category | Recommended Libraries | Purpose |
|---|---|---|
| Data Analysis | Pandas, NumPy | Managing time-series and numerical data |
| Visualization | Matplotlib, Seaborn | Creating price charts and performance plots |
| Indicators | TA-Lib, pandas-ta | Calculating RSI, MACD, EMA, and more |
| Backtesting | Backtrader, Zipline | Testing strategies on historical data |
| Execution | ccxt, Alpaca-py, ib_insync | Connecting to brokers and exchanges |
Coding Your First Strategy
A moving average crossover strategy is a common starting point for beginners. This strategy uses two simple moving averages (SMAs): a shorter-term average such as the 50-day SMA and a longer-term average such as the 200-day SMA. A buy signal occurs when the shorter SMA crosses above the longer SMA, while a sell or short signal occurs when it crosses below.
To build this strategy:
- Install Python and libraries like Pandas, NumPy, Matplotlib, yfinance, and TA-Lib.
- Use yfinance to download historical OHLCV (Open, High, Low, Close, Volume) data for a stock or index like AAPL or SPY.
- Calculate the short-term and long-term SMAs using Pandas.
- Create a column in your dataset to flag crossover points when the short-term SMA moves above or below the long-term SMA.
- Apply this logic to historical data and simulate performance by combining returns with your trading signals.
Once you have coded the strategy, test it in a paper trading environment like Alpaca. Plotting price data alongside the moving averages and buy/sell markers can help confirm that the algorithm behaves as expected. Using tools like Jupyter Notebooks also makes it easier to debug and visualize your strategy.
If you plan to deploy on TradingView, this is also a natural point to use Quant. Traders can describe the crossover idea in plain language, have Quant generate the Pine Script version, then iterate on filters, alerts, and risk logic instead of manually rewriting code each time. That can significantly shorten the path from concept to backtest.
With your first strategy coded and tested, you are ready to explore platforms and live execution workflows.
Selecting Tools and Platforms for Algorithmic Trading
Once you have a handle on coding strategies, the next step is finding the right platform to bring those strategies to life. The platform you choose should provide real-time data, customization options, backtesting capabilities, and seamless programming integration.
What to Look for in a Trading Platform
A good trading platform is not just about placing trades. It should help you research, test, and improve decisions before capital is at risk. Here’s what to prioritize:
- Real-time data access: Delayed data can be fine for learning and some research, but live execution generally requires up-to-the-minute market information.
- Customization options: You should be able to adapt indicators, alerts, and strategy logic to your own goals and risk profile.
- Backtesting capabilities: Historical testing helps you see how a strategy behaves across different market regimes.
- Programming integration: Look for compatibility with Python or TradingView’s Pine Script so you can implement and refine strategies efficiently.
These features become even more useful when they connect research, coding, and deployment in one workflow.
How LuxAlgo Supports Algorithmic Traders
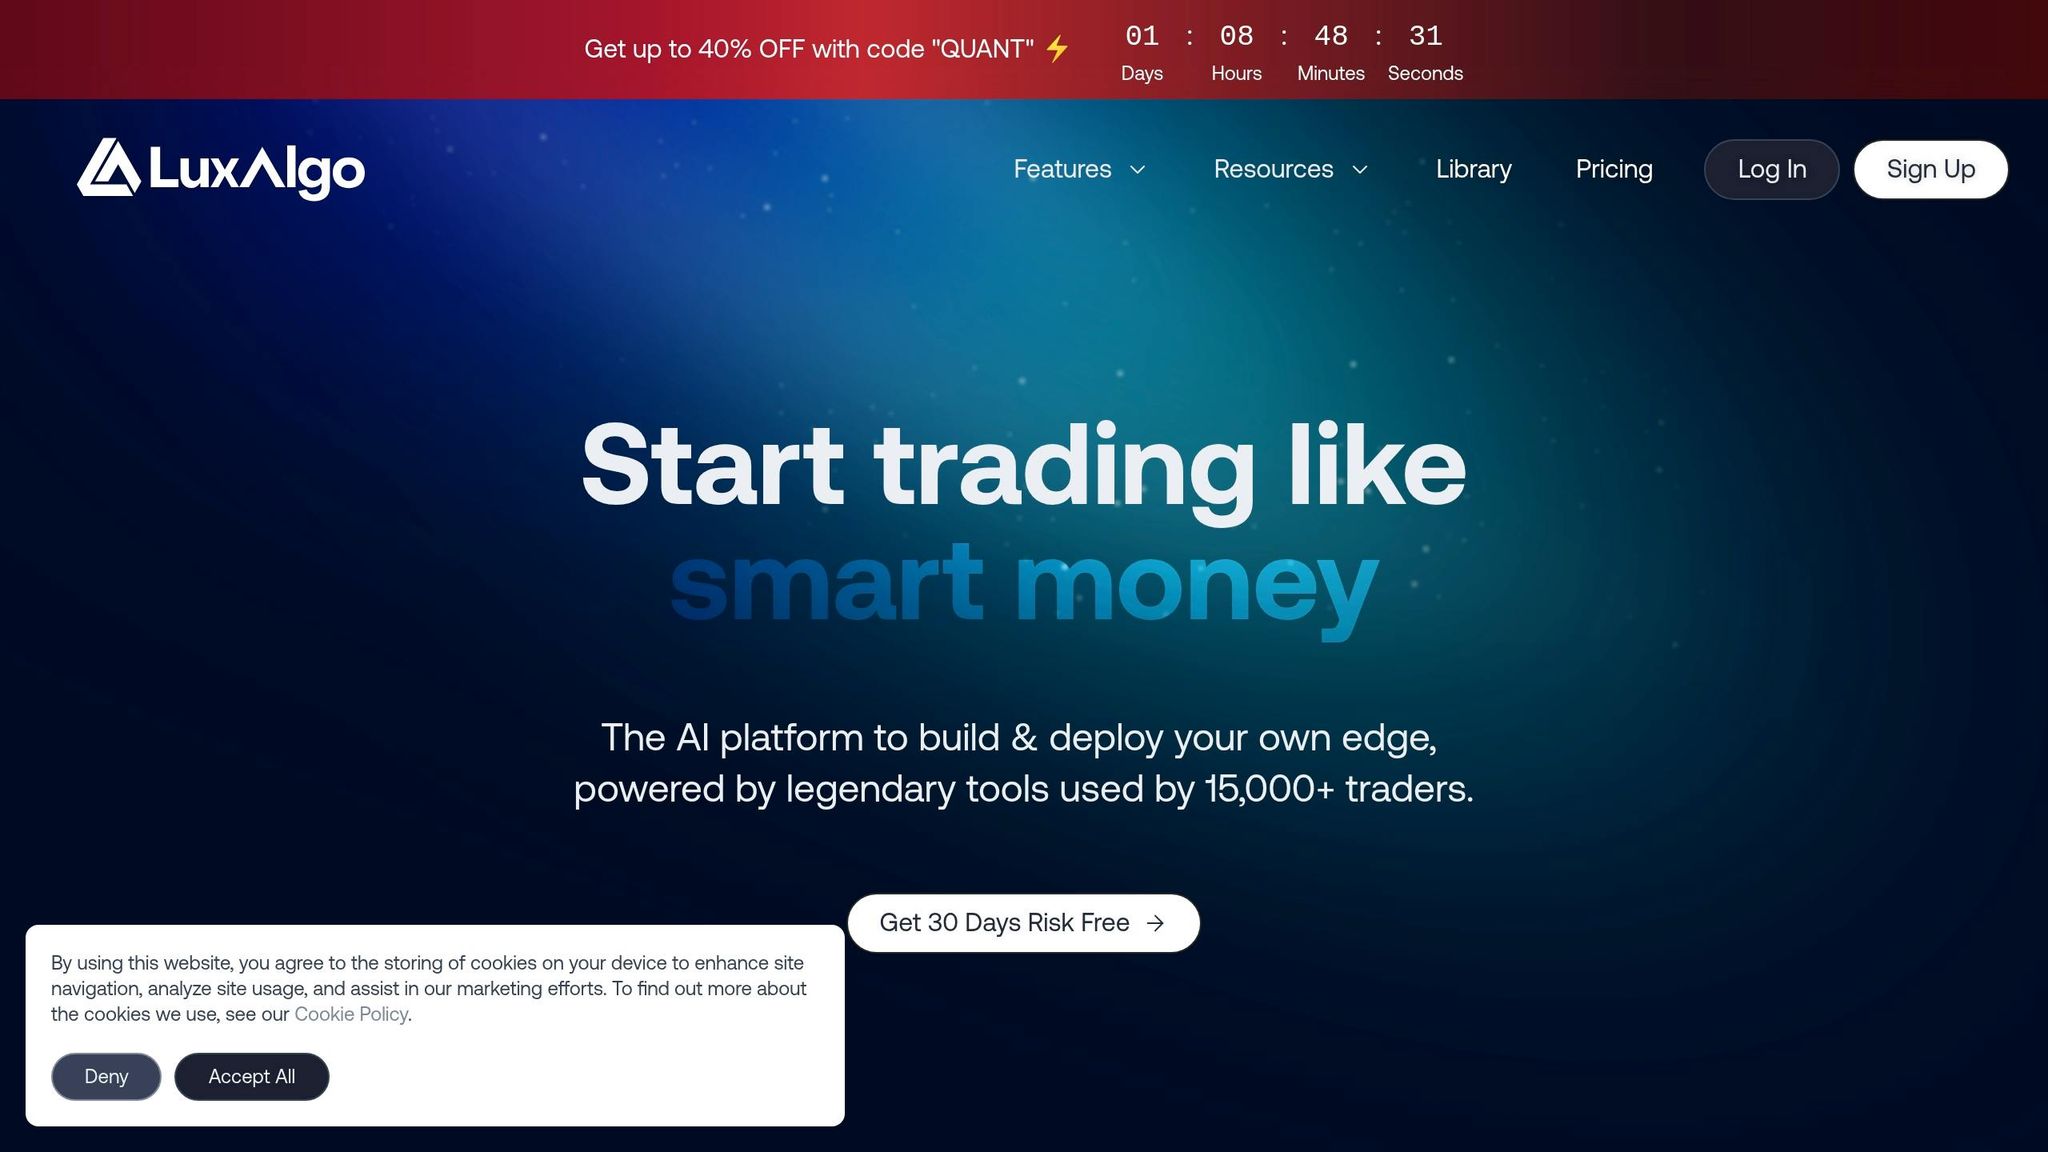
LuxAlgo integrates with TradingView and provides three core Toolkits that help traders structure analysis and automate parts of their workflow:
- Price Action Concepts (PAC): Focuses on price action concepts such as market structure, support and resistance, trendlines, patterns, and liquidity behavior.
- Signals & Overlays (S&O): Provides signals, overlays, and alert-oriented logic for trend-following and reversal workflows.
- Oscillator Matrix (OSC): Emphasizes money flow and trend analysis to help traders spot shifts in momentum and potential exhaustion.
For traders who want to build custom TradingView strategies, LUCID Connectors can pass trigger placeholders from supported LuxAlgo products into Backtesters, helping traders bridge indicator logic with strategy testing. And when the workflow involves writing or modifying Pine Script, LuxAlgo Quant is often the faster route. Quant is purpose-built for TradingView development, so it can help generate indicator code, validate logic, and debug scripts when converting chart ideas into strategies.
LuxAlgo Plans for Algorithmic Traders
LuxAlgo offers a Free plan with lifetime access to its Library, plus Premium and Ultimate plans for traders who want broader access across its TradingView products and AI features. Quant is available to all users, while Premium and Ultimate include higher usage limits.
| Feature | Free Plan | Premium Plan | Ultimate Plan |
|---|---|---|---|
| Monthly Cost | $0 | $39.99 | $59.99 |
| Access Type | Lifetime access | Subscription | Subscription |
| Library | Included | Included | Included |
| Toolkits on TradingView | Not included | Included | Included |
| Quant | Included with standard usage | Included with higher usage limits | Included with higher usage limits |
| AI Backtesting Assistant | Not included | Not included | Included |
| Ideal For | Exploring LuxAlgo’s free Library | Traders using advanced TradingView features | Traders who want TradingView access plus AI-assisted strategy research |
The Premium plan is well suited to traders who want advanced signals, alerts, and broader access on TradingView. Ultimate adds access to AI Backtesting Assistant, which is useful for faster strategy discovery and testing workflows.
Having the right combination of data, scripting support, and backtesting infrastructure can make the difference between a strategy that looks good on paper and one that survives live market conditions.
Building and Testing Your First Strategy
With your platform ready to go, it is time to create a strategy built on rules you can test, measure, and repeat.
Setting Entry and Exit Rules
A good strategy starts with clear rules for when to open and close a trade. These rules can be based on price action such as Break of Structure or Order Blocks, indicators such as RSI or moving averages, or specific trading sessions.
LuxAlgo Backtesters let traders structure these rules using matching logic, where all conditions must be true at the same time, or sequences, where conditions must occur in a defined order. This step-based approach is useful when the setup depends on context rather than a single signal. For example, you might require the market to break a level, confirm with a bullish structure event, and only then allow an entry. If conditions change before the setup completes, invalidation logic can reset the sequence and reduce false signals.
Here’s a quick breakdown of common condition types:
| Condition Type | Examples | Description |
|---|---|---|
| Price Action | CHoCH, BOS, Order Blocks | Based on market structure changes or liquidity-related behavior |
| Session | Time Intervals | Limits trades to specific hours such as the London or New York sessions |
Once your rules are in place, you can move on to backtesting to see how they behave across different market environments.
Testing Strategies with LuxAlgo's AI Backtesting Assistant
LuxAlgo’s AI Backtesting Assistant makes strategy testing more accessible by letting traders describe what they want in plain language and then narrowing results to strategies that fit those goals. As of 2026, the platform supports 93 tickers across major markets and gives access to more than 6 million strategies, which makes it useful for idea discovery as well as comparison testing.
You can refine conditions through a no-code workflow and then deploy the resulting strategy to TradingView. When a trader wants more control over the script itself, this is also where Quant fits naturally. AI Backtesting helps with strategy discovery and evaluation, while Quant helps with Pine Script creation, validation, and debugging when you want custom TradingView indicators or strategies built around your own rules.
Improving Your Strategy
Testing reveals what is working and what is not. Break down your results by trade type such as trend-following, breakout, or reversal setups to see where the edge actually comes from. It is also useful to review performance by market session, because a strategy that performs well during active hours may weaken during low-volatility periods.
Fine-tune your risk management as well. Tight stop-losses can cause repeated premature exits, while wider stops may improve trade survival but worsen average loss size. The right balance depends on the asset, timeframe, and volatility. Position sizing matters just as much. Many traders prefer risking a small fixed percentage of capital per trade because it keeps drawdowns more manageable and makes performance easier to evaluate over time.
"Position sizing is a technique that determines how many units you should trade to achieve your desired level of risk. And this is the closest thing you can get to the 'holy grail'." - Rayner Teo
Refining a strategy is an ongoing process. Markets evolve, volatility shifts, and execution conditions change. The goal is not to create a perfect system for one historical sample, but a process that remains useful as market conditions change.
Running and Optimizing Strategies in Live Markets
Moving from Testing to Live Trading
Transitioning from testing to live trading is where a strategy’s practical reliability is finally tested. Backtests do not fully capture real-world issues like slippage, latency, spread changes, partial fills, or psychological pressure. A cautious rollout helps reduce these risks. Many traders begin with only a fraction of their intended size so they can study how the system behaves in live conditions without taking unnecessary exposure.
A better way to think about the transition is this: live deployment is not about maximizing profit immediately. It is about verifying that the strategy can handle actual execution. That means monitoring whether alerts trigger on time, whether orders fill near expected prices, and whether the live environment produces materially different results than the backtest.
Once live, keep a close eye on execution quality to ensure your strategy behaves as expected.
Tracking and Adjusting Performance
Real-time tracking of execution slippage and latency is essential for understanding how live results differ from your model assumptions. Weekly reviews of trade distribution, equity curve shape, and setup quality can reveal subtle deterioration before it becomes severe.
Just as backtesting helped refine your entry logic, live trading provides another layer of feedback. If live results deviate from expectations, revisit areas such as entry filters, session rules, stop placement, and risk assumptions. This is also where automation helps. Reducing manual intervention can lower the odds of inconsistency, hesitation, and rule-breaking.
For traders building on TradingView, Quant can help speed up this feedback loop. Instead of manually editing Pine Script every time you discover a flaw, you can use Quant to refine logic, debug errors, and test alternate implementations more efficiently.
Optimizing Strategies Over Time
Markets evolve, and strategies should evolve with them. The goal is not to force live performance to match an idealized backtest, but to develop a reliable edge that survives changing conditions. That usually comes from consistent review and small, evidence-based adjustments rather than constant reinvention.
Use optimization carefully. Parameters that work brilliantly on one historical sample may fail in new conditions if they were overfit to noise. Periodically re-check assumptions, test changes across different market regimes, and document what changed and why. Small improvements in stop placement, session selection, or signal filtering often matter more than dramatic strategy rewrites.
Conclusion
Summary of the Learning Path
Becoming an algorithmic trader is a step-by-step process. It starts with understanding market structure, risk management, and execution. From there, you can begin coding simple strategies in Python or Pine Script, backtest those ideas, and gradually move toward paper trading and live deployment. Each stage turns theory into a repeatable trading process.
Python remains a practical starting point thanks to libraries such as Pandas, NumPy, and TA-Lib, which simplify data analysis and strategy research. At the same time, AI-assisted workflows have made TradingView development far more accessible. Traders can now research strategies with AI Backtesting Assistant and build custom Pine Script indicators or strategies with LuxAlgo Quant without relying entirely on manual coding.
This structured path gives beginners a realistic way to build confidence while keeping risk under control.
Getting Started as a Beginner
Now that the path is clear, the next step is action. Start with realistic goals focused on skill development rather than quick profits. Use paper trading or small positions to validate ideas in a lower-risk setting. Pay attention to risk-reward ratio vs. win rate and keep a structured performance journal so your decisions stay grounded in data.
LuxAlgo provides access to its Library and to exclusive TradingView products such as PAC, S&O, and OSC for traders who want more advanced workflows. If your focus is scripting and automation, Quant is especially relevant because it helps convert trade ideas, chart annotations, and indicator concepts into deployable Pine Script on TradingView.
Stay disciplined, keep learning, and let the numbers guide your decisions as you continue to develop in this field.
FAQs
How much money do I need to start algo trading?
There is no single dollar amount required to start algorithmic trading. The amount depends on your goals, the broker or platform you use, the asset class you trade, and the level of diversification you want. Many beginners start with a modest amount of capital, but the smarter approach is to begin with whatever amount allows you to test responsibly without creating emotional pressure. Start small, focus on process, and scale only after you have a strategy that has been tested and monitored in real conditions.
How do I avoid overfitting when backtesting a strategy?
To reduce overfitting, keep your rules as simple as possible, avoid excessive parameter tuning, and test across multiple market environments. Use out-of-sample data and, when possible, forward testing or paper trading to see whether performance holds up outside the original development sample. You should also include realistic assumptions for spreads, commissions, and slippage so the strategy is not evaluated under unrealistically favorable conditions.
What’s the safest way to go from paper trading to live trading?
The safest transition is gradual. Validate your strategy with out-of-sample data, then move to paper trading, and then go live with very small position sizes. Track slippage, latency, and rule adherence closely during the early phase. Use strict risk controls such as stop-loss logic, position sizing limits, and maximum exposure thresholds. Scale only when live results remain consistent with your expectations over a meaningful sample of trades.
References
LuxAlgo Resources
- LuxAlgo
- AI Backtesting Assistant
- LuxAlgo Quant
- Quant Documentation
- LUCID Connectors Documentation
- LuxAlgo Pricing
- LuxAlgo Library
- Stress Testing for Trading Strategies
- The Key to Understanding RSI
- Risk-Reward Ratio vs. Win Rate