
Improve trading strategies with AI: automated backtests, natural‑language Pine Script generation, indicator toolkits, and risk tuning.
AI is transforming trading by reducing emotional bias, speeding up analysis, and automating complex tasks. This guide breaks down how AI-driven workflows with LuxAlgo can streamline backtesting, strategy creation, validation, and performance optimization in 2026. Key highlights include:
- Automated Backtesting: Test and compare strategies faster with the LuxAlgo AI Backtesting Assistant.
- Custom Strategy Creation: Use natural-language prompts and LuxAlgo Quant to generate and refine Pine Script® indicators and strategies for TradingView®.
- Advanced Analysis: LuxAlgo’s Oscillator Matrix, Price Action Concepts, and Signals & Overlays help detect patterns, structure, momentum, and potential entries or exits.
- Risk Management: AI-assisted workflows can optimize stop-loss and take-profit logic using historical performance data and forward validation.
- Continuous Improvement: Walk-forward validation, re-testing, and structured review help strategies adapt to changing market conditions.
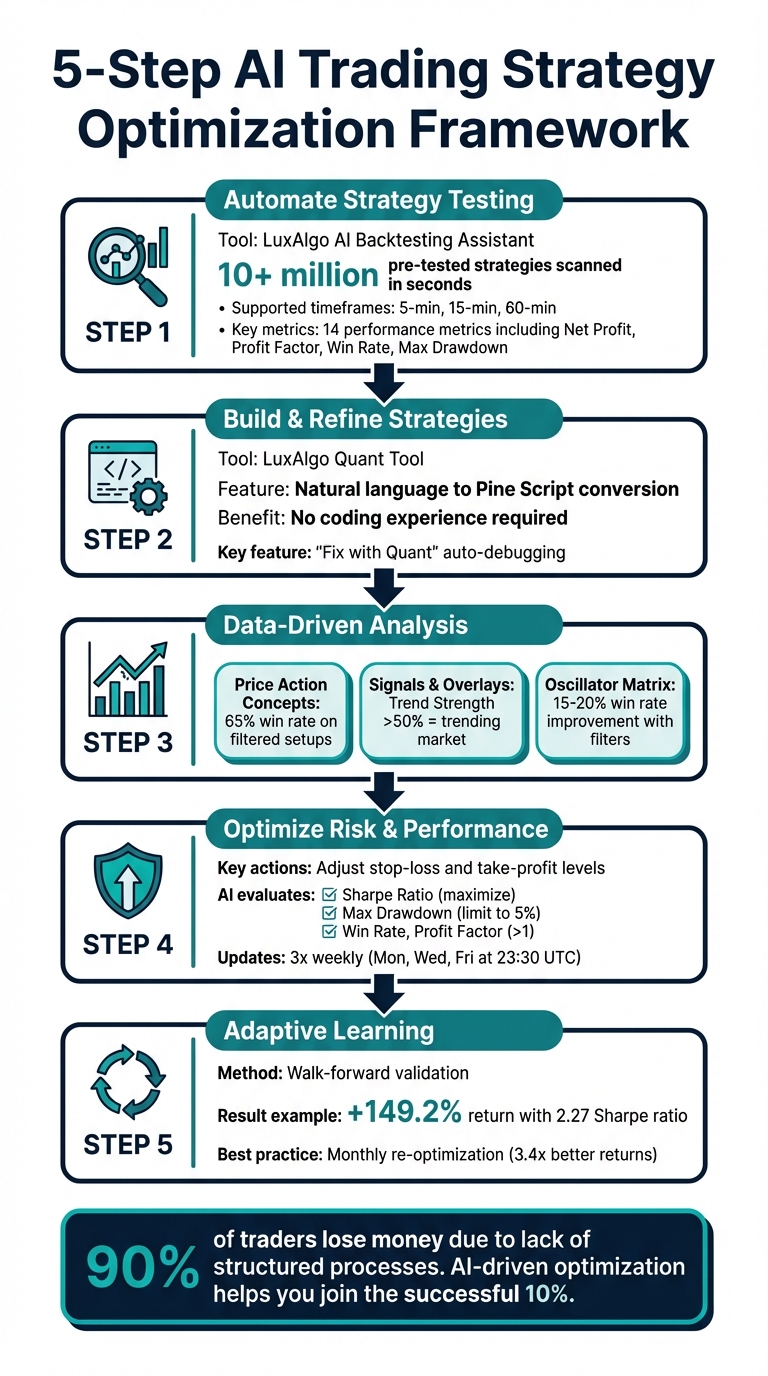
5-Step AI Trading Strategy Optimization Framework
Best AI for Trading Strategies in 2026
Step 1: Automate Strategy Testing with LuxAlgo AI Backtesting Assistant
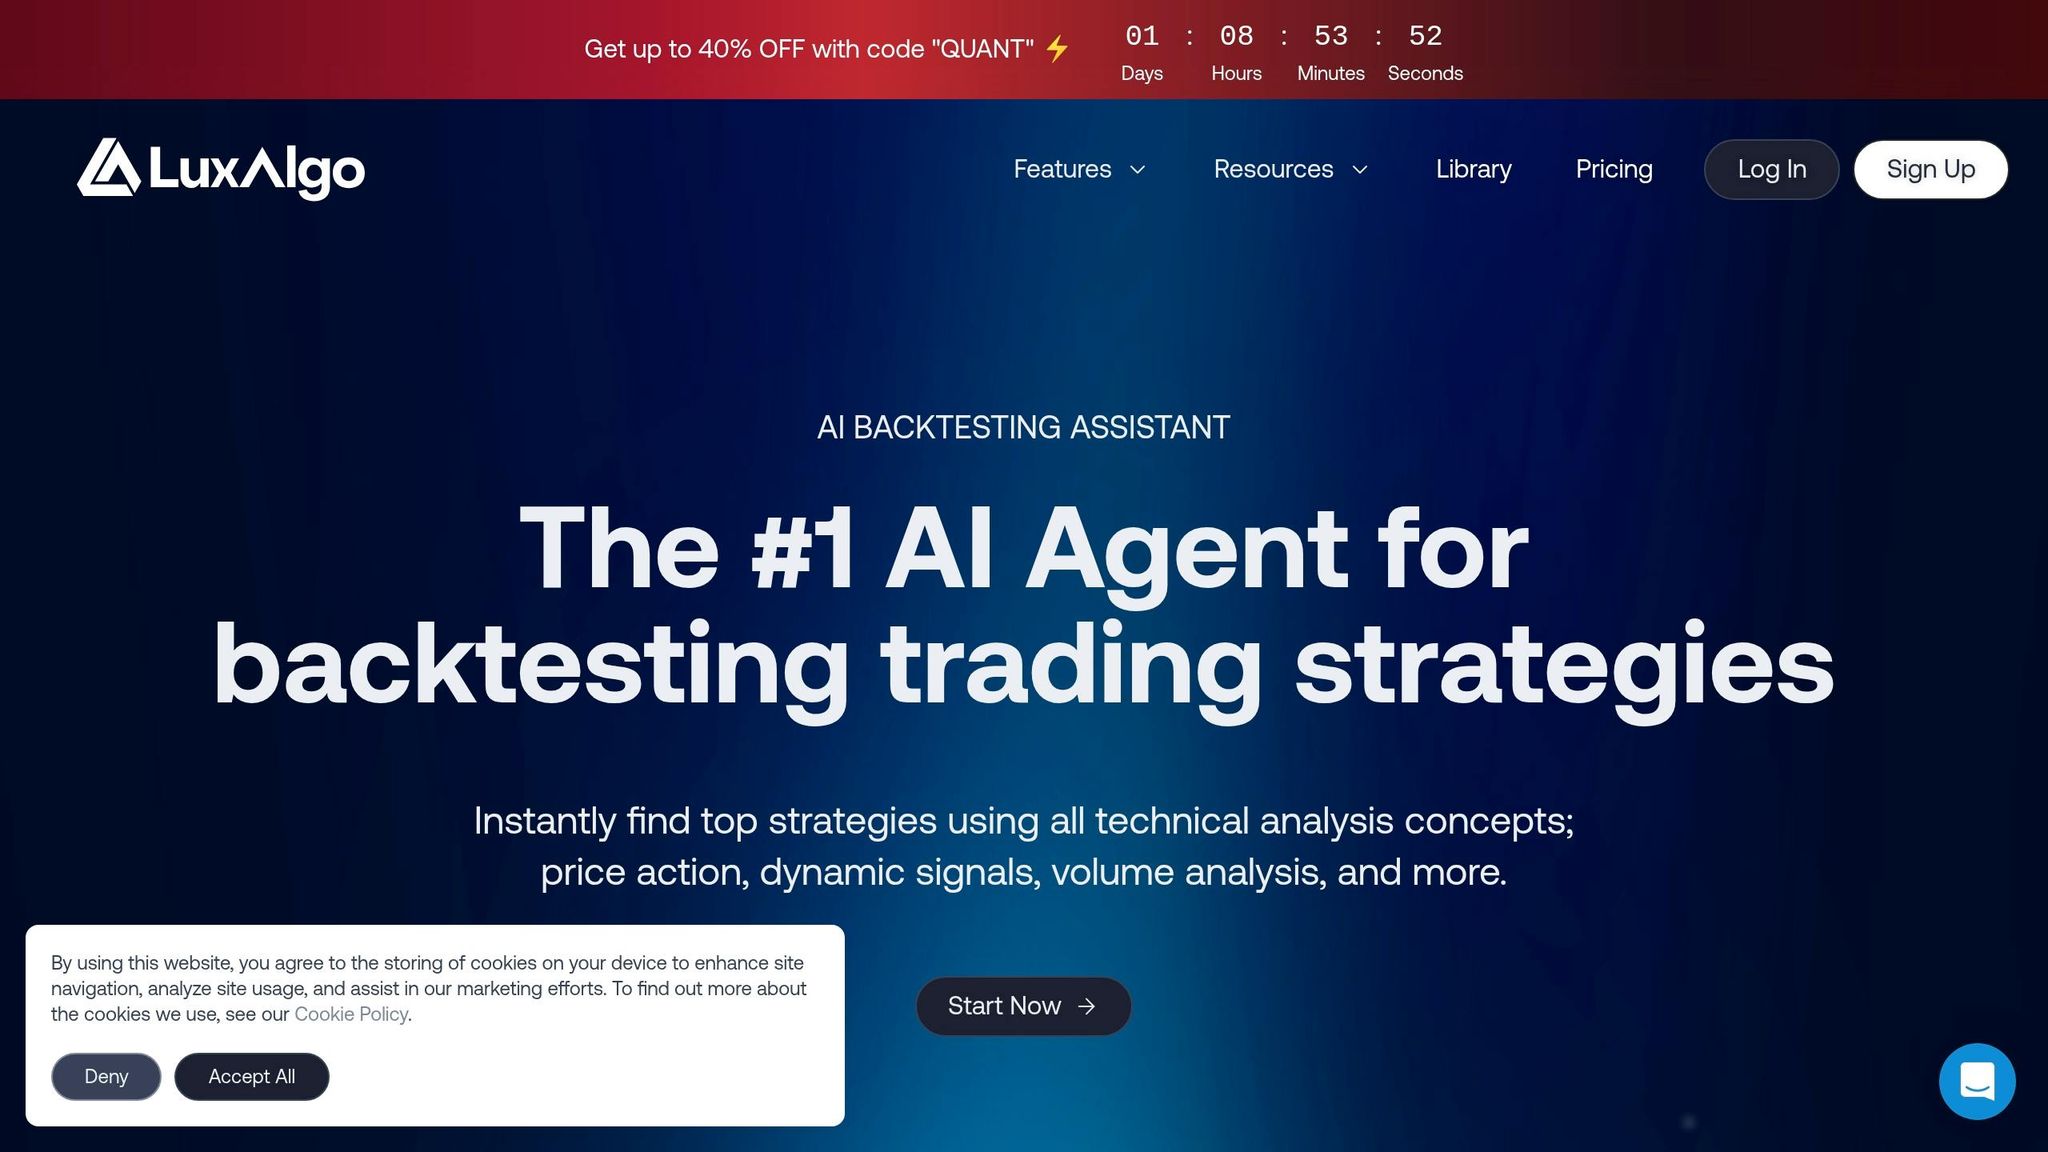
Manually testing trading strategies can be time-consuming and error-prone. The LuxAlgo AI Backtesting Assistant offers a faster workflow by helping traders search a large database of pre-tested strategy logic built around LuxAlgo features and compare results in seconds. Instead of coding each variation by hand, you can enter a natural-language prompt such as "Find the strategy with the highest net profit on BTCUSD 5 minute", and the assistant will return ranked matches based on your criteria.
That workflow is especially useful when you want to validate an idea before writing any code. Rather than building a strategy from scratch, you can first identify promising rule sets, compare metrics, and then move the best candidate into TradingView for deeper analysis. This shortens the path from idea to testable system and keeps you focused on market logic instead of repetitive manual screening.
The platform supports multiple asset classes, including stocks, ETFs, cryptocurrencies, forex, commodities, and futures. For equity traders, venues such as Cboe U.S. Equities provide useful context for listed markets, while TradingView deployment makes it easier to visualize and refine strategy behavior once a setup passes initial screening.
How to Set Up the AI Backtesting Assistant
Getting started is straightforward. Open the AI Backtesting Assistant on the LuxAlgo platform and use the chat box to describe what you want to find. The assistant can help retrieve strategies using filters such as ticker, timeframe, profitability, drawdown profile, and feature usage. A practical workflow is to begin broad and then narrow your search.
- Start with a simple request, such as "Best trend-following strategy on EURUSD 15 minute".
- Then refine it with constraints like "higher win rate", "lower drawdown", or "only long trades".
- Review the returned metrics before moving the idea into a charting and scripting environment.
For example, a prompt such as "Highest profit factor on AAPL 15 minute" can surface candidate strategies quickly. If the first response is too broad, tighten the query by specifying regime, side, holding time, or acceptable drawdown. That step-by-step approach usually produces cleaner results than trying to describe a highly complex system in one prompt.
The assistant can return multiple strategies in a single comparison table, which is useful when you want to assess trade-offs instead of only chasing the top net-profit result. In practice, many traders care more about consistency, exposure, and drawdown behavior than a single headline number.
Core Features for Testing Strategies
The AI Backtesting Assistant includes several features that make strategy evaluation more practical:
- Access performance metrics such as Net Profit, Profit Factor, Win Rate, Max Drawdown, and Average Trade to compare strategies against your actual goals.
- Filter trades by profitability, duration, direction, or date to study how the strategy behaves under different conditions.
- Move promising strategy logic into TradingView for visualization and refinement.
- Use the returned strategy context as a starting point for deeper iteration with Quant, especially if you want to convert an idea into custom Pine Script® logic.
- Save and monitor validated strategies using LuxAlgo’s broader workflow, including alerts where relevant.
This is where AI becomes more than a search shortcut. Instead of only finding a strategy, you can turn the output into a structured development loop: discover, compare, refine, validate, and deploy.
Apply Backtesting Data to Improve Your Strategies
The assistant also helps you compare strategies side by side, making it easier to choose one that fits your risk tolerance and execution style. You can refine entry and exit behavior by filtering trades based on side, result, holding time, or profit and loss.
For instance, if you find that a strategy performs well only during trending periods, you can add a confirmation filter before deployment. A simple example is only taking long entries when price is above a long-term moving average. That kind of adjustment can improve consistency by aligning the strategy with broader market structure instead of forcing trades in every environment.
Once you have a promising ruleset, Quant’s documentation becomes especially relevant. It can help you turn chart logic, indicator conditions, or even annotated screenshots into Pine Script® that is easier to test, debug, and iterate on in TradingView.
Step 2: Build and Refine Strategies with LuxAlgo Quant
LuxAlgo Quant is an AI coding agent specialized in generating and validating Pine Script® indicators and strategies for TradingView®. While the AI Backtesting Assistant helps you discover and compare strategy ideas, Quant helps you turn those ideas into working code. That makes it especially useful for traders who understand setups and market structure but do not want to spend hours writing or debugging scripts manually.
Because Quant is purpose-built for Pine Script® workflows rather than general chat, it can help with code generation, code review, validation, debugging, and chart-to-code or image-to-code tasks. In practice, that means you can move from a verbal description like "build a mean reversion strategy with RSI and session filters" to a script you can test on TradingView much faster than with a generic AI assistant.
Quant is trained for TradingView development and Pine Script® logic, which makes it a strong fit for indicator creation, strategy prototyping, and iterative debugging. It is particularly helpful when you want to convert a trading concept into deployable code without getting stuck on syntax, plotting, alert conditions, or strategy architecture.
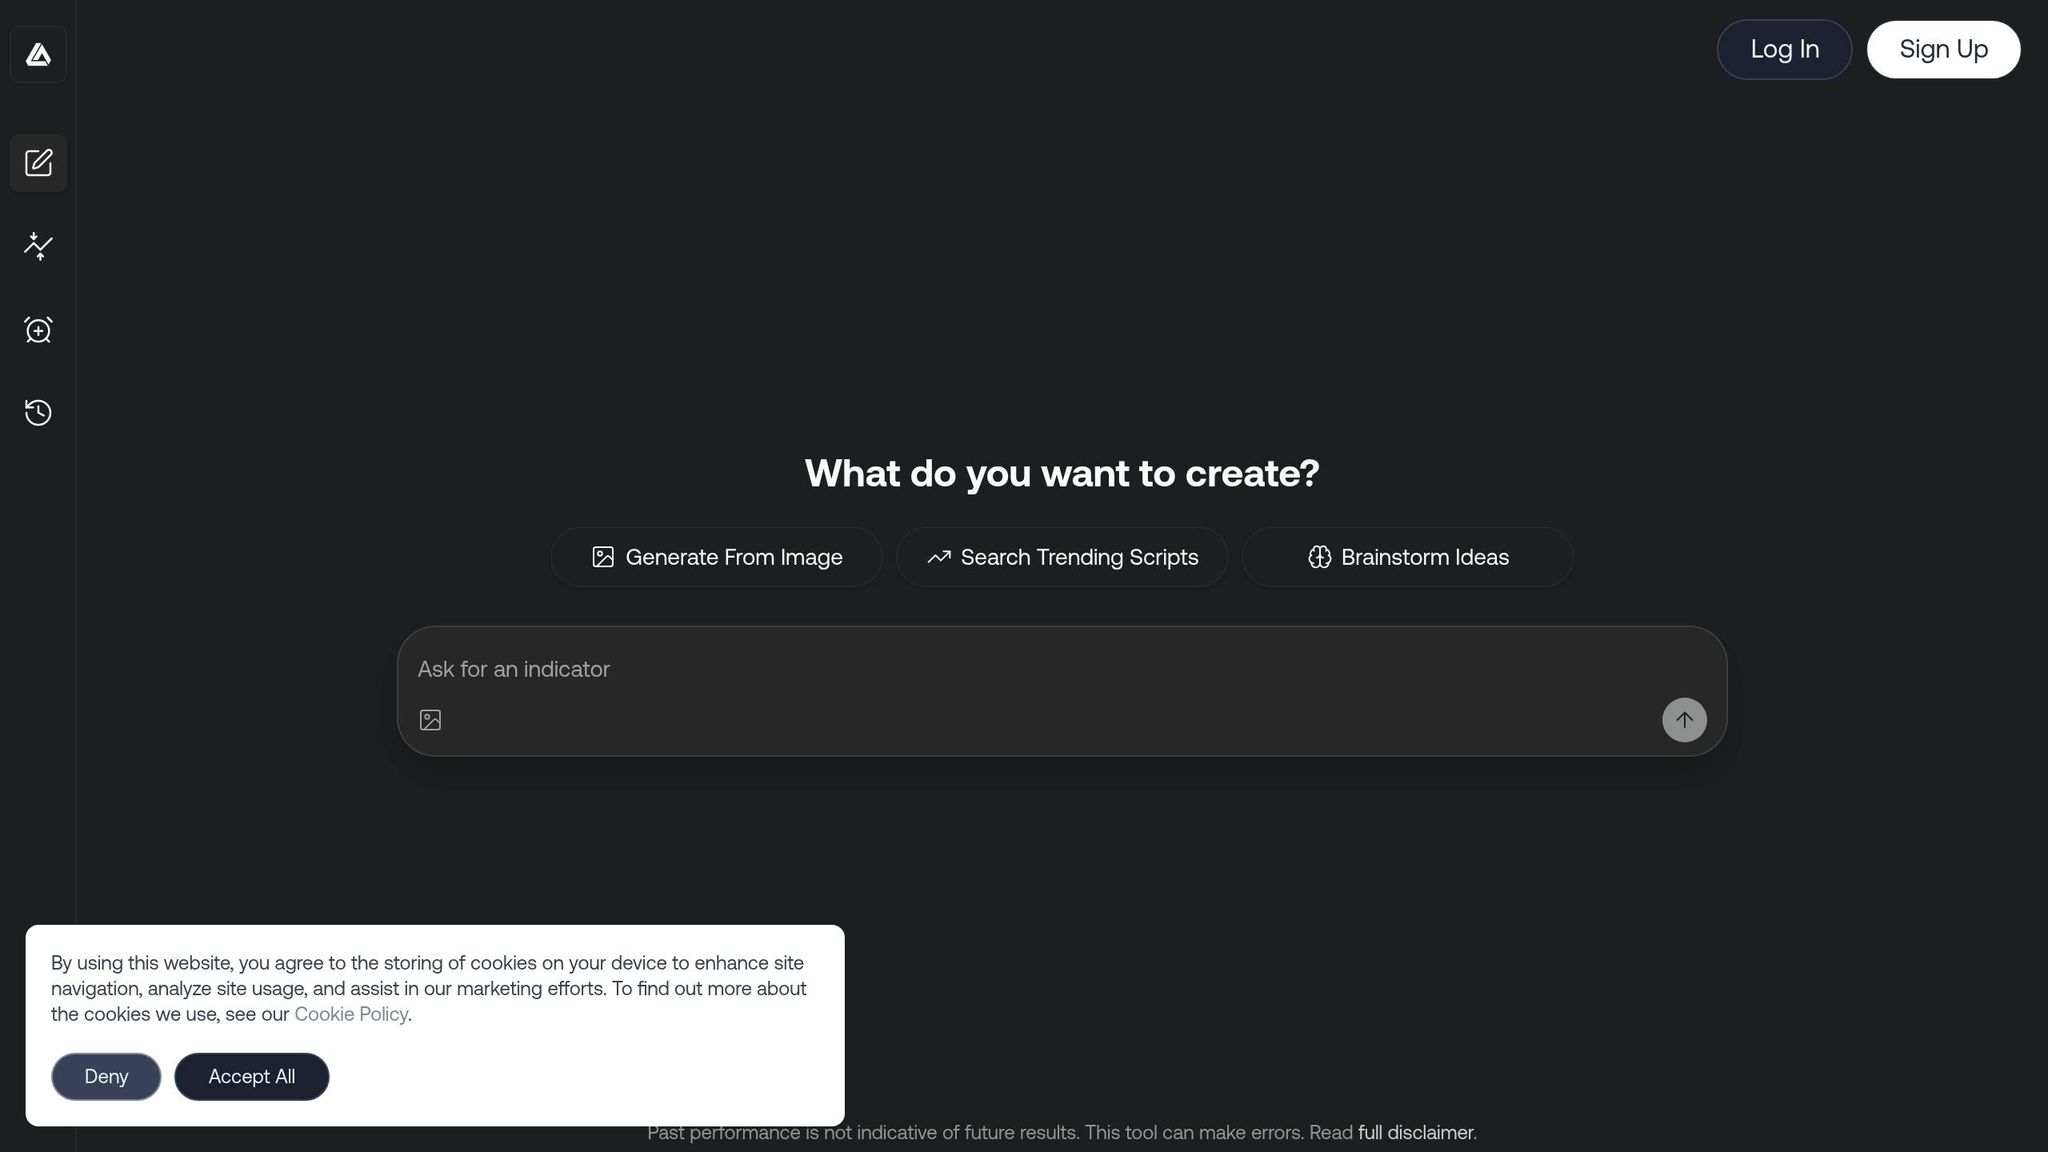
Create Strategies Using Natural Language Prompts
The process starts with a text prompt. For example, you might type: "Create a mean reversion strategy for US indexes using RSI filters." Quant can then generate initial Pine Script® code that you can test across multiple timeframes. This lowers the barrier for traders with strong market intuition but limited coding experience.
Here are a few practical ways to use it:
- Start with your trading edge. If you believe an index tends to revert after extended moves, ask Quant to translate that idea into precise entry and exit rules.
- Use image-based workflows to upload a chart or setup and have Quant reverse-engineer the concept into Pine Script®.
- Begin with a simple prompt such as "moving average crossover strategy", then iteratively add filters, session logic, alerts, or risk rules.
- Ask Quant to explain the generated logic in steps before you deploy it, which is useful when you want to understand exactly what the code is doing.
This is one of the clearest areas where AI can save time without reducing rigor. You still need to evaluate the logic, but you no longer need to manually build every component before you can test whether the idea has merit.
Optimize and Debug Your Strategies
Once your initial code is ready, the next step is refinement. Quant can help identify syntax issues, repair broken logic, and reduce friction during iteration. That is valuable because strategy development usually fails less from a lack of ideas and more from small implementation mistakes that distort backtest results.
Fine-tuning typically involves adjusting parameters such as take-profit and stop-loss logic, entry confirmations, session filters, and position-management rules. Backtest the strategy across different timeframes and evaluate metrics such as Sharpe ratio, max drawdown, win rate, and profit factor. To reduce the risk of curve fitting, pair this with walk-forward optimization or out-of-sample validation.
When refining code, make one change at a time. For example, first request "add alerts", then "add a volume filter", then "convert this to a strategy". This incremental workflow makes it easier to catch errors, compare results, and avoid hiding the real reason a strategy improved or deteriorated.
For traders working directly in Pine Script®, Quant can be the fastest way to move from concept to validation because it helps with generation and debugging inside the same workflow. That is particularly useful when you want to test several variants quickly before deciding which one deserves deeper optimization.
Deploy Custom Strategies on TradingView

Deployment is straightforward. Copy your finalized code into TradingView’s Pine Editor, compile it, and apply it to your chart. Before using the strategy live, make sure it includes realistic assumptions around position sizing, exits, slippage, fees, and trading sessions.
To minimize risk, start with simulation or very small size. Adjust position sizing so drawdowns remain within a range you can actually tolerate. That matters because many strategies look attractive in backtests but become untradeable once normal slippage, spread variation, or execution delays are included.
For strategies that combine logic from multiple LuxAlgo product areas, you can use LUCID connectors to combine conditions across Price Action Concepts, Signals & Overlays, and Oscillator Matrix into one cohesive ruleset. After deployment, revalidate your strategy after meaningful market changes and consider adding regime filters so the system behaves differently in trending and ranging conditions.
Step 3: Use LuxAlgo Toolkits for Data-Driven Analysis
After refining strategy logic with Quant, the next step is to strengthen it with higher-quality market context. LuxAlgo provides three specialized TradingView toolkits—Price Action Concepts, Signals & Overlays, and Oscillator Matrix—that help automate pattern recognition, structure analysis, momentum reading, and signal confirmation.
These toolkits can improve decision quality in two ways. First, they make discretionary analysis more consistent by surfacing the same kinds of information on every chart. Second, they help systematic traders identify inputs that can later be formalized into Pine Script® logic with Quant or tested further in a backtester.
Price Action Concepts Toolkit
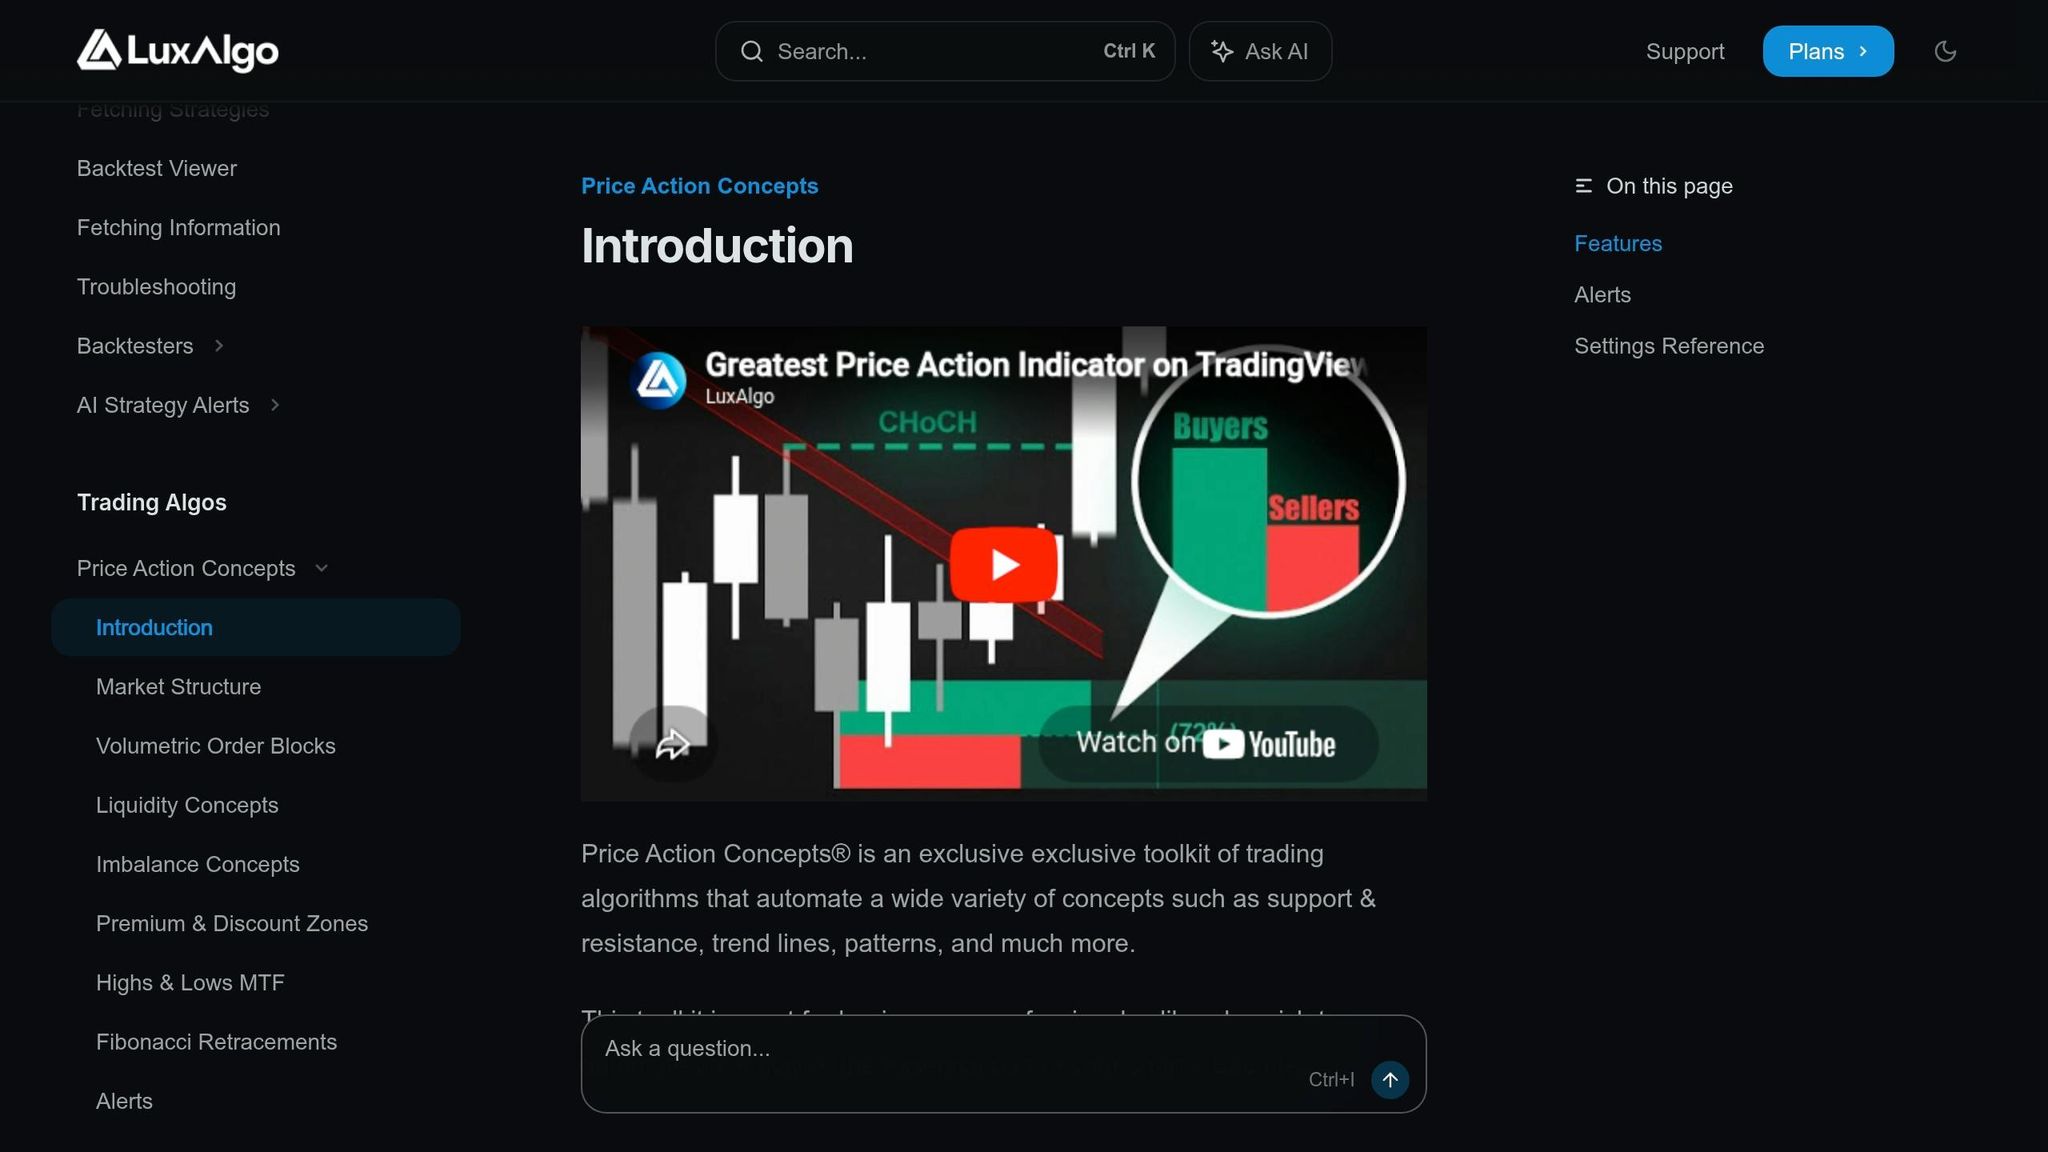
This toolkit focuses on automating price action analysis, including support and resistance, trendlines, patterns, market structure, and volumetric order blocks. That helps traders reduce the subjectivity that often comes with discretionary chart work.
For example, on a bullish USD/JPY setup using a 1-hour chart, the toolkit may highlight structure shifts, areas of liquidity, and a potential order-block reaction near a swing low. Instead of manually marking every level, you can evaluate whether price is reacting in a way that aligns with your thesis and then decide whether that logic should remain discretionary or be turned into a formal strategy.
The toolkit also tracks market structure in real time, helping traders distinguish between reversals and continuations through concepts such as Change of Character (CHoCH) and Break of Structure (BOS). It offers both shorter-term and broader swing-based context, which is useful when you want to align an entry model with the dominant trend rather than treat every signal equally.
If you discover a recurring chart behavior with Price Action Concepts, that is another natural point to use Quant: describe the setup in plain English or upload a screenshot, then use the generated Pine Script® as a prototype for further testing.
Signals & Overlays Toolkit
This toolkit generates buy and sell signals by analyzing multi-timeframe trend and momentum conditions. It includes both Confirmation Signals and Contrarian Signals, allowing traders to adapt the workflow to either trend-following or reversal-oriented styles.
The dashboard adds useful context through metrics such as Trend Strength and Volume Sentiment, while signal settings allow you to calibrate responsiveness to current market conditions. That can help reduce the common problem of using one static sensitivity across assets and volatility regimes that behave very differently.
For traders who want to move beyond visual analysis, this toolkit can also serve as a building block for automation. A common workflow is to validate discretionary observations with Signals & Overlays first, then use Quant to encode the strongest recurring combinations into a Pine Script® strategy.
Oscillator Matrix Toolkit
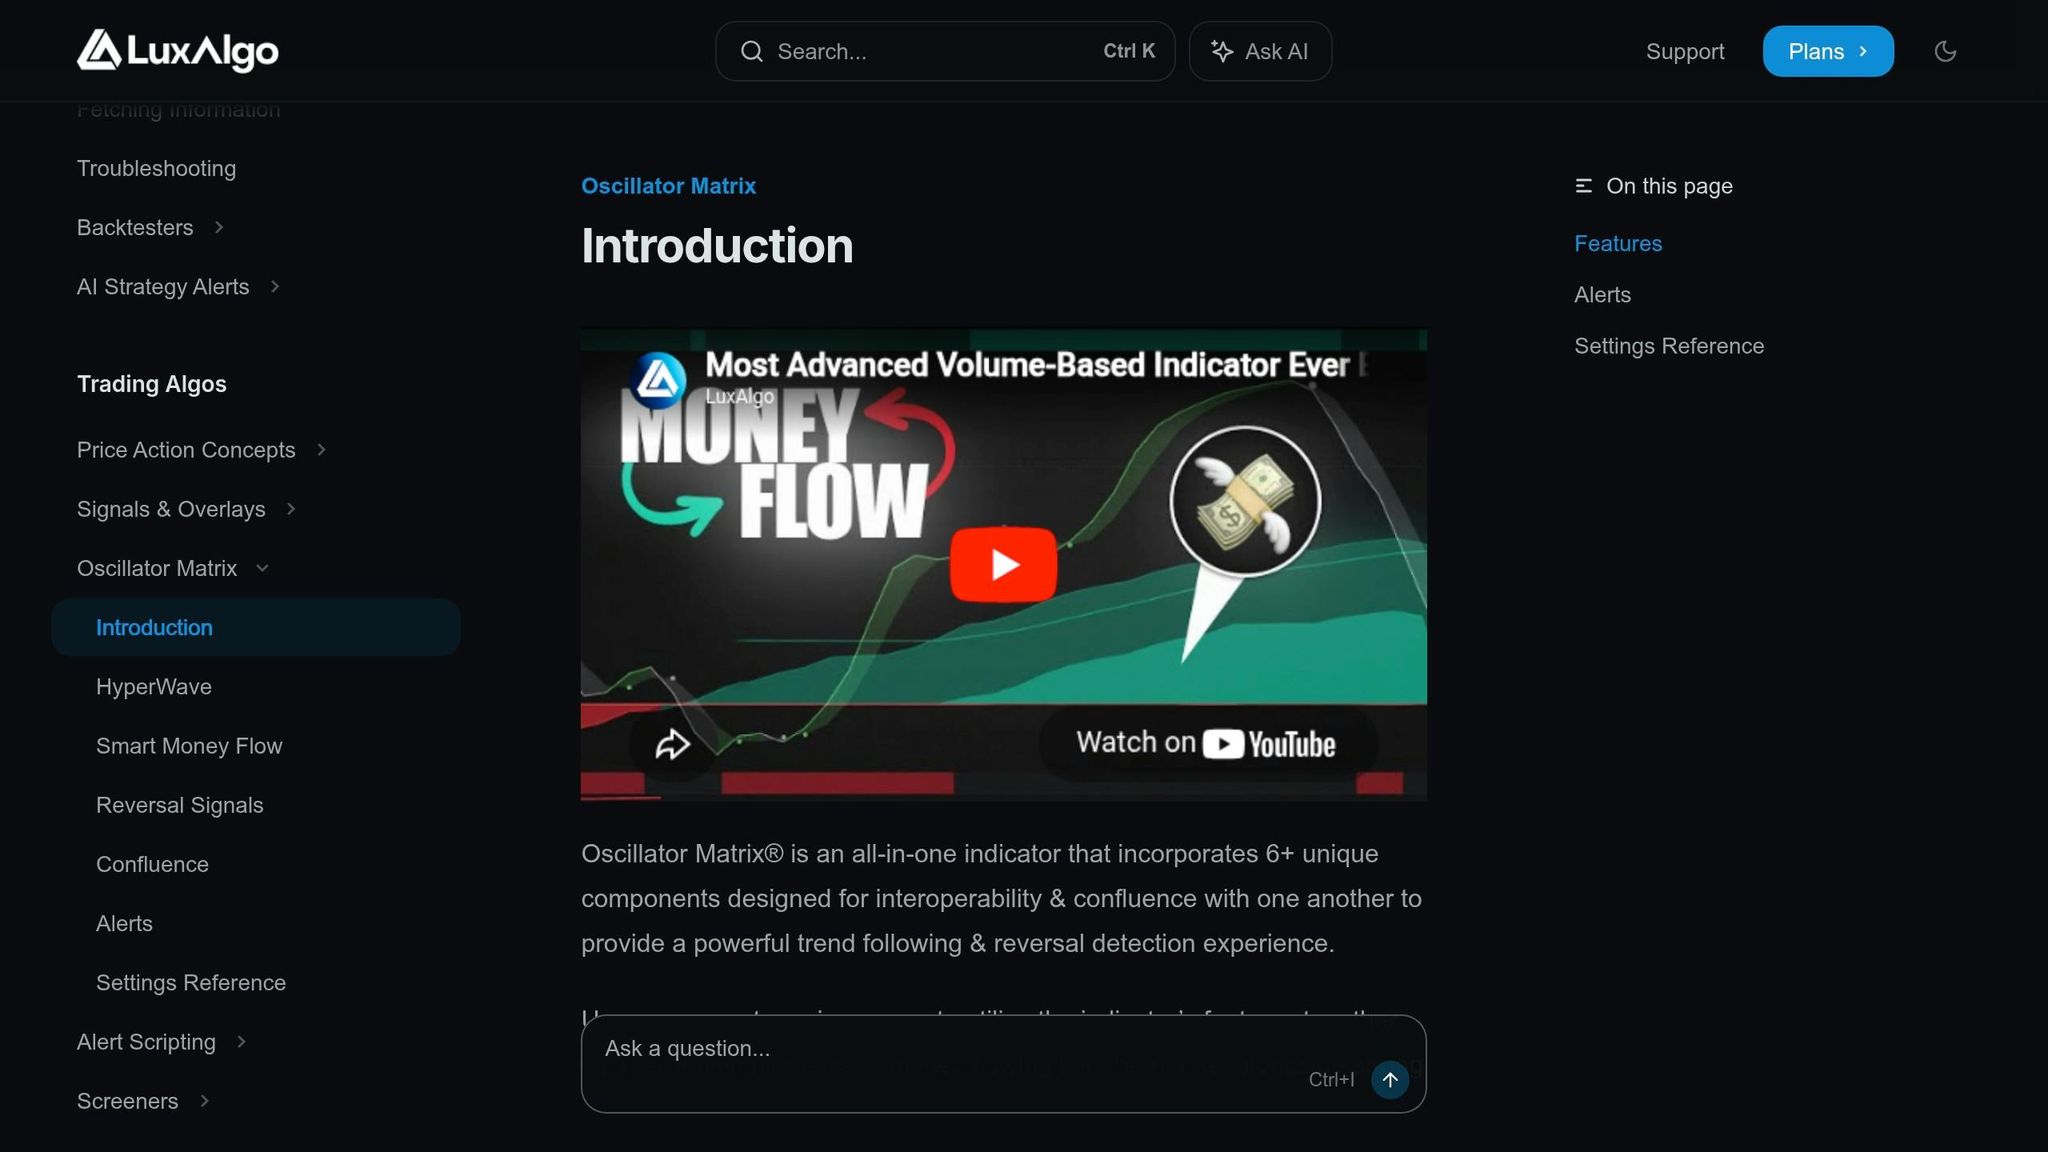
This toolkit consolidates multiple momentum and reversal components into one view, making it easier to spot divergences and confluence without stacking a chart with disconnected indicators. Traders often compare its signals with classic oscillators such as MACD and the stochastic oscillator, but the benefit here is having a more integrated workflow designed for confluence.
The toolkit distinguishes between smaller retracements and larger reversal conditions and includes components such as Smart Money Flow. It can be especially useful when you want to confirm whether a price move is backed by improving momentum or whether it is stalling into a possible reversal zone.
Using divergence analysis alongside structured validation can improve the quality of trade selection, particularly in trending environments where traders often struggle to separate healthy pullbacks from genuine reversals. The settings reference also allows you to adjust how selective the toolkit is, which can make a big difference when you switch between intraday and higher-timeframe use cases.
For rule-based traders, Backtester (OSC) provides a direct way to test oscillator-based entry and exit logic more systematically.
| Toolkit | Primary Function | Why It Matters |
|---|---|---|
| Price Action Concepts | Automates structure, levels, patterns, and order-block analysis | Reduces subjectivity in discretionary chart reading |
| Signals & Overlays | Provides signal, trend, and overlay context | Helps refine entries and filter weak setups |
| Oscillator Matrix | Tracks momentum, reversals, and confluence | Improves timing and confirmation for continuation or reversal ideas |
Step 4: Optimize Risk and Performance Metrics with AI
After identifying patterns and generating signals, the next step is managing risk and measuring performance. AI-driven optimization is useful here because it can help you test parameter changes more systematically, rather than relying on guesswork or one-off chart examples.
Adjust Stop-Loss and Take-Profit Levels
Exit logic matters as much as entries. Many strategies fail not because the signal is poor, but because stop-loss and take-profit rules are too tight, too wide, or inconsistent across volatility environments. One common approach is using Average True Range (ATR)-based exits to scale stop distance with market volatility.
You can also test forecast-based take-profit targets, trailing stops, time-based exits, and partial profit-taking. The goal is not to find one magic exit rule, but to identify which logic best matches the behavior of your entry model. If a strategy produces good entries but weak realized performance, the problem is often in trade management rather than signal generation.
LuxAlgo’s backtesting workflows make it easier to compare these variations without rebuilding the entire strategy each time. In practical terms, that means you can optimize around risk-adjusted outcomes such as drawdown control or profit factor instead of focusing solely on raw net profit.
Improve Win Rates and Portfolio Performance
Fine-tuning a strategy requires monitoring core metrics such as Sharpe ratio, maximum drawdown, win rate, expectancy, and profit factor. Each one highlights a different aspect of performance. For example, a high win rate may look attractive, but if average losses are much larger than average gains, the strategy may still be fragile.
- Sharpe ratio helps you understand return relative to volatility.
- Maximum drawdown shows the strategy’s worst peak-to-trough decline.
- Win rate tells you how often trades succeed, but not how meaningful those wins are.
- Profit factor helps compare total gross profits to total gross losses.
- Expectancy gives a more complete per-trade view of long-term edge.
The AI Backtesting Assistant can help surface strategies that match these objectives, while Quant can help you modify code to pursue them more directly. For example, you might use the assistant to find a strategy with acceptable drawdown, then ask Quant to add a session filter or alternate exit rule to improve expectancy without changing the core entry logic.
To avoid overfitting, use fresh out-of-sample data and repeat the validation process over time. A strategy that only works in one historical slice is much less valuable than one that remains stable across multiple environments.
| Metric | Description | Typical Use |
|---|---|---|
| Sharpe Ratio | Risk-adjusted return | Compare efficiency across strategies |
| Maximum Drawdown | Largest peak-to-trough decline | Set realistic risk limits |
| Win Rate | Percentage of winning trades | Measure consistency, not edge by itself |
| Profit Factor | Gross profits divided by gross losses | Evaluate payoff quality |
| Expectancy | Average expected profit or loss per trade | Assess long-term viability |
Track Strategy Performance with AI Analytics
Once a strategy is optimized, ongoing monitoring becomes essential. Good systems degrade when market conditions change, spreads widen, volatility compresses, or the regime shifts from trend to range. AI-assisted analytics can help you identify when that is happening faster than manual review alone.
For example, if performance deteriorates during volatile opens or low-liquidity sessions, you may need to add session filters or restrict the strategy to specific market states. If results vary sharply by asset, you may be treating a multi-asset idea as universal when it is really regime-specific.
Exporting trade data for further review, checking distribution changes, and revalidating after major market shifts are all part of a disciplined process. The stronger your review loop, the less likely you are to keep trading a model that has already lost its edge.
Step 5: Use Adaptive Learning for Continuous Improvement
After backtesting, development, and optimization, the final step is building a process that keeps improving. Markets change constantly, so the real advantage is not finding one perfect setup but building a workflow that helps you test, adapt, and redeploy intelligently.
Adjust Aggressiveness Settings for Different Market Conditions
Markets behave differently in strong trends, compressed ranges, news-driven volatility, and low-liquidity sessions. A trend-following system that works well in directional conditions may perform poorly in choppy, mean-reverting markets. That is why aggressiveness, signal sensitivity, and position sizing should reflect both your risk tolerance and the environment you are trading.
In practice, this means using tighter exposure during unstable periods, wider tolerance only when volatility structure supports it, and rechecking whether your filters still match current market behavior. AI can help accelerate this review, but the purpose is not constant random tweaking. It is disciplined adaptation.
Apply Walk-Forward Validation for Strategy Testing
Walk-forward optimization is one of the most practical ways to test whether a strategy can survive changing conditions. Instead of optimizing parameters on one fixed historical window and trusting the result, you repeatedly optimize on one segment and test on the next unseen segment. This helps reveal whether performance is robust or simply overfit to a specific slice of history.
A useful routine is to divide your history into rolling training and testing windows, optimize on the training sample, then record the out-of-sample result before shifting forward and repeating the process. If the strategy remains stable across these windows, confidence improves. If performance collapses once the test window changes, that is a warning that the model may be too fragile for live use.
Monthly or otherwise regular re-optimization can be more effective than making large, infrequent changes, especially for shorter-term strategies. The key is to keep the process systematic and comparable rather than reacting emotionally to a recent winning or losing streak.
Build an Iterative Workflow for Strategy Optimization
Combining AI-assisted adjustments with walk-forward testing creates an iterative workflow that is much more resilient than one-time optimization. A practical routine is simple: update your data, re-run your tests, compare results with prior baselines, and only deploy changes that improve robustness rather than just improving one headline metric.
This is another area where Quant fits naturally. If testing shows that the issue is in entry timing, exit logic, or signal confirmation, you can use Quant to modify the Pine Script® quickly, validate the new version, and send it back into your testing loop without rebuilding the script manually from scratch.
After each test cycle, review trade duration, performance by session, volatility sensitivity, and how results change across assets. Over time, this iterative process can reveal whether the strategy has a genuine edge or whether it only looks good under narrow conditions.
"Proper backtesting isn't about finding the highest number. It's about numbers that survive the future."
Conclusion: Deploy AI-Optimized Strategies for Better Results
Key Takeaways from AI-Driven Optimization
AI has pushed trading workflows toward a more data-driven process. The five-step framework covered here—automated strategy discovery with the AI Backtesting Assistant, strategy creation and debugging with Quant, chart analysis with LuxAlgo’s TradingView toolkits, risk optimization, and adaptive validation—helps traders reduce manual overhead while improving consistency.
Each part solves a different problem. Backtesting helps validate ideas before capital is exposed. Quant reduces coding friction by helping traders turn concepts into working Pine Script® faster. The toolkits improve discretionary and systematic analysis by surfacing structure, trend, momentum, and confluence more consistently. Adaptive review then helps keep the strategy relevant as market conditions evolve.
The bigger takeaway is that AI should support process quality, not replace discipline. Metrics such as Sharpe ratio, drawdown, expectancy, and profit factor still matter, and validation still matters. What AI changes is the speed and structure of how you move from idea to tested implementation.
Next Steps with LuxAlgo
A practical next step is to explore LuxAlgo pricing and match the workflow to your needs. The Free plan provides lifetime access to hundreds of tools across multiple platforms. Premium adds advanced TradingView signals, alerts, oscillator tools, and higher usage limits for Quant. Ultimate includes the AI Backtesting platform and higher-tier access across LuxAlgo features.
If your main goal is strategy development for TradingView, start with Quant and the Quant introduction docs. If your priority is testing existing ideas faster, begin with the AI Backtesting Assistant. If you trade more visually and want stronger chart context, use the three TradingView toolkits as the foundation and then formalize your best ideas into code later.
Once you have a validated approach, deploy it carefully on TradingView, monitor performance, and continue re-testing as conditions evolve. The strongest workflow is iterative: discover, code, validate, deploy, review, and improve.
FAQs
How do I avoid overfitting when optimizing a strategy with AI?
To reduce the risk of overfitting in AI-driven trading strategies, use strong validation methods such as out-of-sample testing, walk-forward analysis, and Monte Carlo testing where appropriate. Keep the model logic as simple as possible, avoid excessive parameter tuning, and test across multiple market conditions. The goal is not to maximize one historical result, but to find logic that remains stable when conditions change.
What performance metrics should I prioritize for my trading goals?
Prioritize metrics that balance return and risk. Expectancy helps you understand average edge per trade, win rate shows consistency, Sharpe ratio measures risk-adjusted performance, maximum drawdown highlights capital risk, and profit factor shows the relationship between gross gains and gross losses. Reviewing these together gives a clearer picture than relying on net profit alone.
How often should I re-optimize and validate my strategy as markets change?
There is no universal schedule, but you should review a strategy regularly and after meaningful market shifts. Shorter-term systems usually need more frequent validation than higher-timeframe approaches. The important part is using a structured routine—such as periodic walk-forward testing and out-of-sample review—rather than making reactive changes after every losing streak.
References
LuxAlgo Resources
- LuxAlgo
- AI Backtesting Assistant
- Quant
- Quant Introduction
- Price Action Concepts Introduction
- Volumetric Order Blocks
- Signals & Overlays Introduction
- Signals & Overlays Dashboard
- Signals & Overlays Signal Settings
- Oscillator Matrix Introduction
- Oscillator Matrix Settings
- Smart Money Flow
- Backtester (OSC) Introduction
- LUCID Connectors
- LuxAlgo Pricing