Learn about common backtesting errors that can mislead traders and how to avoid them for more reliable trading strategies.
Backtesting helps traders test strategies on historical data to see how they might have performed, but common mistakes can lead to misleading results. Here’s what you need to know:
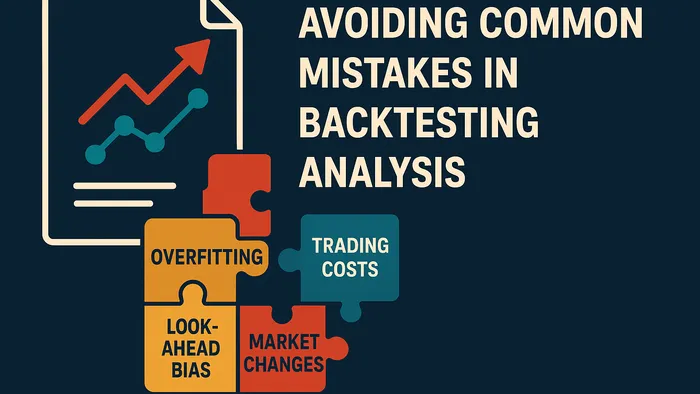
- Overfitting: Strategies overly tailored to past data may fail in live markets. Avoid by using simpler rules, testing on unseen data, and validating across assets.
- Trading Costs: Ignoring fees, spreads, and slippage inflates performance. Always include realistic costs in your backtests.
- Look-Ahead Bias: Using future data by mistake can create false profitability. Ensure your tests only use data available at the time of the trade.
- Market Changes: Strategies that worked in one market phase may fail in another. Test across bull, bear, and sideways markets to ensure robustness.
Quick Tips for Better Backtesting:
- Account for all costs (commissions, slippage, spreads).
- Use realistic metrics (e.g., Sharpe ratios under 3).
- Test on diverse market conditions and avoid future data.
- Keep strategies simple and avoid overfitting.
Avoiding Common Mistakes in Backtesting Analysis
Overfitting: When Strategies Match Past Data Too Well
Overfitting happens when a trading strategy becomes overly tailored to historical data patterns, giving a false impression of its effectiveness. Think of it like memorizing answers for a test without understanding the concepts, while it may work perfectly for the test, it falls apart in new situations. Similarly, an overfitted strategy might excel in backtesting but struggle in actual market conditions.
Signs of Overfitting
Here are some common indicators that your strategy might be too focused on historical data:
| Warning Sign | Description | Impact |
|---|---|---|
| Unrealistic Returns | Shows extremely high returns in backtesting | Leads to overconfidence |
| Complex Rules | Relies on too many finely tuned parameters | Reduces flexibility |
| Outlier Dependence | Success depends on a few exceptional trades | Makes the strategy unstable |
| Perfect Historical Fit | Performs flawlessly on past data | Struggles with new scenarios |
Detecting Overfitting Problems
Experienced traders use specific performance metrics to spot overfitting:
- Profit Factor: A range of 1.5 to 2.0 is generally realistic and sustainable.
- Sharpe Ratio: Values above 3 are extremely rare and could signal overfitting.
- Sortino Ratio: Ratios above 3 might also indicate overfitting.
If these metrics seem unusually high, it’s a red flag. Reliable strategies typically deliver steady, moderate returns. Once overfitting is identified, it’s crucial to refine your testing methods to address the issue.
Methods to Reduce Overfitting
To build strategies that perform better in real markets, try these approaches:
- Data Splitting: Use an 80/20 split for training and testing data. This ensures your strategy works well on unseen data.
- Cross-Asset Validation: Test your strategy on different assets and market conditions. A solid strategy should perform consistently across various scenarios, not just in a specific timeframe.
- Parameter Simplification: Reduce the number of variables and rules in your strategy. Simpler strategies are generally more reliable and less prone to overfitting.
Trading Costs and Price Slippage Effects
Trading costs and price slippage can have a major impact on your backtesting results. Many traders fail to properly account for these factors, leading to overly optimistic performance projections. Here's how to address them effectively.
Including All Trading Costs
Trading costs go beyond just broker commissions. Here's a closer look at the main costs that can affect your strategy's real world performance:
| Cost Type | Description | Typical Impact |
|---|---|---|
| Commissions | Broker execution fees | $0.0035 per share (IBKR) |
| Regulatory Fees | SEC and FINRA charges | $22.90 per $1M traded |
| Spread Costs | Difference between bid and ask | Varies by asset liquidity |
| Market Impact | Price movement from large orders | 0.1-1% of trade value |
For example, buying 100 shares of Apple stock at $150 per share through Interactive Brokers would result in approximately $17.23 in total costs. This includes execution fees, slippage, market impact, and regulatory fees.
"No matter the base of your strategy (TA, fundament, news events, options, AI), you must always account for all the costs, or your expectations are flawed." - Peter Kostovcik
In addition to fixed costs, dynamic factors like price slippage can further influence your results.
Price Slippage in Testing
Hidden costs like slippage can significantly affect your strategy, especially in volatile markets or when trading assets with lower liquidity. Slippage happens when a trade is executed at a price different from what you expected.
For instance, in a recent Apple stock trade, the bid/ask spread was $183.50/$183.53. A market order for 100 shares was filled at $183.57, resulting in $0.04 per share slippage ($4.00 total).
To handle slippage in your backtesting:
- Simulate slippage under 2% for liquid assets.
- Adjust for market conditions, expect higher slippage during volatile periods.
- Use time filters to avoid trading during low liquidity times.
- Implement smarter order types, like limit orders or TWAP/VWAP executions.
For better accuracy, refine your strategy by:
- Adding spread entry filters to avoid trades with excessive spreads.
- Trading on higher timeframes to allow for wider stop losses.
- Running Monte Carlo simulations to test how different spread scenarios affect performance.
Strategies with frequent trades or trades during illiquid hours are especially prone to spread related costs. Make sure your backtesting reflects these realities for more reliable and actionable insights.
Look-Ahead Bias: Using Future Data by Mistake
Look-ahead bias is another critical error that can distort backtesting results, alongside overfitting and cost miscalculations. This issue arises when future data sneaks into your backtest, creating an illusion of profitability that wouldn't exist in real world trading.
What is Look-Ahead Bias?
Look-ahead bias happens when your backtesting model uses information that wasn't available at the time a trading decision should have been made. For example, if a strategy relies on the next day’s opening price to make decisions at the previous day’s market close, it introduces this bias and inflates performance.
"Look-ahead bias in backtests usually involves counting returns before the entry signal and in some cases also omitting returns due to the exit signal. In essence, this amounts to a backward shift of returns and it is mostly due to coding errors." - Michael Harris
Where Look-Ahead Bias Occurs
This bias often stems from specific sources, such as:
| Source | Description | Warning Signs |
|---|---|---|
| Data Misalignment | Using future prices in current calculations | Unrealistic entry/exit prices |
| Indicator Setup | Technical indicators incorporating future data | Smoother than expected signals |
A notable example occurred in 2016 when a hedge fund promoted an index momentum strategy with impressive alpha. A deeper review uncovered look-ahead bias in their calculations, invalidating their results. Identifying these issues is essential to ensure your backtests reflect actual market conditions.
Removing Look-Ahead Bias
To avoid look-ahead bias in your backtesting process:
- Use proper data handling
Employ bitemporal data systems to ensure only data available at the time is used. - Select the right framework
Event-driven backtesting systems process data sequentially, reducing the risk of accidentally accessing future data. - Validate your strategy
Double check that no future data influences your strategy. Tools like Freqtrade can help flag potential biases in your signals.
"Look-ahead is the worst type of bias because the results are wrong." - Michael Harris
If your strategy boasts annual returns above 12% or Sharpe ratios over 1.5, it’s worth investigating for potential look-ahead bias. While real world trading quickly exposes this bias, other forms may only surface after market conditions change.
Taking these steps ensures your backtests are accurate and dependable, building on earlier strategies to avoid common pitfalls.
Market Conditions and Trading Environment Changes
Market conditions play a crucial role in trading performance, yet they are often overlooked during backtesting. Different market phases can dramatically alter strategy outcomes, so it's essential to account for these shifts. Let’s break down how these conditions impact strategy metrics.
Impact of Market Conditions
Market conditions shape unique trading environments, directly influencing strategy success. Research by Paul Geertsema and Helen Lu highlights how various trading factors behave differently depending on market phases:
| Market Factor | Bull Market Performance | Bear Market Performance |
|---|---|---|
| Value | Moderate | Strong Positive |
| Momentum | Low | High Positive |
| Size (SMB) | Positive | Negative |
| Profitability | Average | Strong Positive |
"The value, profitability, investment and momentum factors are all more profitable in bear markets than in bull markets." - Paul Geertsema and Helen Lu
For example, historical data from 1962 reveals that bear market regimes produced a 15.77% return. However, it’s important to note that market dynamics have shifted significantly since 2001, meaning past performance may not reliably predict future results. This underscores the need to avoid overfitting and making unrealistic assumptions.
Testing Across Market Types
Effective backtesting requires validating strategies across a range of market conditions:
- Identify Market Phases: Different phases demand tailored testing:
- Bull markets with low volatility
- Bull markets with high volatility
- Bear markets
- Sideways markets
- Validate Across Time Periods: Split historical data into distinct sets for testing and validation. This ensures strategies perform consistently in varying market environments.
- Account for Market Changes: Markets today differ greatly from the past due to technological progress and regulatory shifts. Factors to consider include:
- Changes in market microstructure
- Advancements in trading technology
- Evolving behaviors of market participants
- Variations in liquidity conditions
Conclusion: Creating Better Backtests
Key Backtesting Mistakes
Let’s recap some of the most common errors traders make during backtesting and how to avoid them.
"Backtesting enables traders to analyze a strategy on different market conditions from different historical data periods. How does this strategy do during the 2008 Great Financial Crisis? How does it do during a strong bull run from 2013 to 2015? How did it do during the Covid drop of 2020 or some future market conditions we do not know yet?" - David Bergstrom
| Error Type | Impact | How to Avoid It |
|---|---|---|
| Overfitting | Misleading performance results | Use out-of-sample validation |
| Transaction Costs | Overestimated profitability | Account for spreads and fees |
| Look-Ahead Bias | Faulty strategy signals | Only use historical data |
| Market Evolution | Strategy becomes outdated | Test strategies across cycles |
These mistakes highlight why thorough testing is essential for creating reliable trading strategies.
Steps for Better Testing
Research confirms that successful backtesting requires a systematic and realistic approach. Here’s how you can improve your process:
- Set Clear Rules: Define entry and exit points, risk controls, position sizing, stop losses, and profit targets before testing begins. Clarity here avoids any ambiguity during analysis.
- Simulate Real Conditions: Incorporate all trading costs, such as spreads and fees, and ensure your test includes a diverse and robust dataset. Tools like ProRealTime’s ProBacktest can help you analyze metrics and fine tune parameters effectively.
- Test Across Market Scenarios: Evaluate your strategy under various market conditions, including bull, bear, and sideways trends, as well as during events like the 2008 financial crisis or the 2020 Covid crash.


