
Explore the essentials of candlestick patterns, their components, and how to use them effectively in trading for better market analysis.
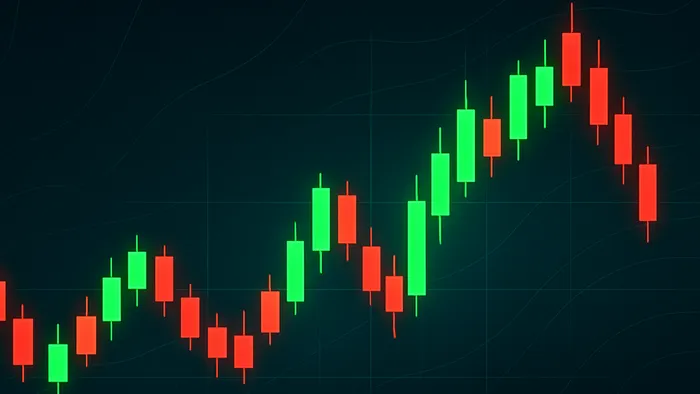
Candlestick charts are a go-to method for traders to analyse price movements and market sentiment. Here’s what you need to know:
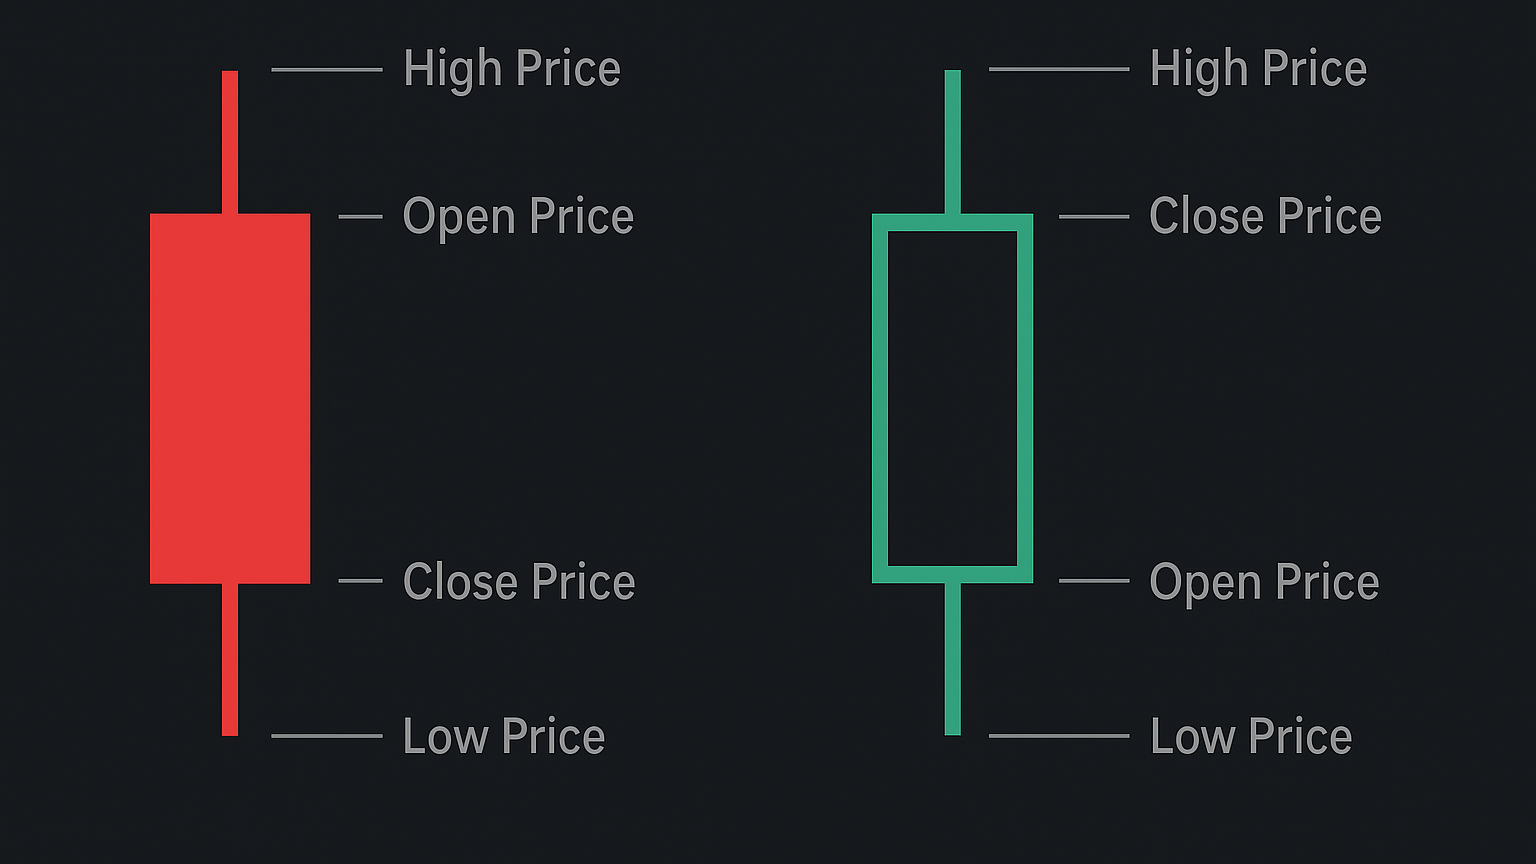
- Core Elements - Each candlestick shows the open, close, high, and low prices for a trading period.
- Visual Insights - Candlestick bodies and wicks reveal trends, momentum, and sentiment shifts.
- Colours Matter - Green or white candles indicate price increases (bullish), while red or black show decreases (bearish).
- Patterns - Learn key patterns such as Doji, Hammer, and Engulfing to anticipate reversals or continuations.
Quick Tip - Combine candlestick analysis with indicators like the RSI or volume trends for better accuracy. Start with higher timeframes to filter out noise, then drill down for entries. If you use TradingView, the Price Action Concepts™ indicator's order block detection algorithm can help create confluence for candle pattern identification while it auto-detects support and resistance zones, streamlining your workflow.
Candlestick charts simplify complex market behaviour, making them essential for traders at all levels.
Free reversal candlestick pattern detection tool
Parts of a Candlestick
Understanding the components of a candlestick is key to analysing market behaviour. Each part tells a story about price action and trader sentiment over a specific period. For users who prefer full automation, the LuxAlgo Candlestick Structure indicator labels these elements in real time.
Body Structure
The real body - the thick central part of the candlestick - represents the range between the opening and closing prices. Its size carries important clues about market activity:
| Body Type | Market Indication | Trading Insight |
|---|---|---|
| Long Body | Strong, directional price move | High conviction among traders |
| Short Body | Limited price movement | Indecision in the market |
| No Body (Doji) | Open and close are equal | Highlights uncertainty |
Comparing the body’s size to recent candles helps gauge momentum shifts.
Upper and Lower Wicks
The thin lines above and below the body - called wicks or shadows - mark the highest and lowest prices reached during the period. Their lengths reveal:
- Long upper wicks - buyers pushed prices higher but couldn’t sustain the move.
- Long lower wicks - sellers drove prices down, but buyers regained control.
- Short wicks - stable trading with limited price rejection.
The balance between wick length and body size can hint at potential trend reversals. Pairing wicks with the Signals & Overlays™ indicator gives additional confirmation through adaptive signals.
Colour Meanings
Candlestick colours offer quick visual cues about direction:
- Green or white candles - close is higher than open (bullish).
- Red or black candles - close is lower than open (bearish).
Rapid colour changes or large candles can highlight strong trends, especially in volatile markets.
Common Candlestick Patterns
Recognising candlestick patterns gives traders a clear view of potential price moves.
1-Candle Patterns
Single-candle patterns reflect sentiment in a single period. Key examples:
| Pattern | Description | Market Signal | Key Characteristics |
|---|---|---|---|
| Doji | Equal open/close | Indecision | Small body, variable shadows |
| Hammer | Long lower shadow | Bullish reversal | Lower shadow ≥ 2× body |
| Shooting Star | Long upper shadow | Bearish reversal | Appears after an uptrend |
| Marubozu | No shadows | Strong trend | Full body candle |
“Each candlestick is a simple, yet powerful tool for understanding the market.” - Steve Nison
Single-candle patterns are best confirmed by later price action; multi-candle patterns provide a broader context.
Multi-Candle Patterns
Patterns formed by two or more candles offer deeper insights but take longer to develop.
- Engulfing Patterns - one candle completely engulfs the previous body. Bullish engulfing often forms near support in a downtrend; bearish engulfing near resistance in an uptrend. The Oscillator Matrix™ toolkit can add confluence by highlighting money-flow shifts.
- Morning & Evening Stars - three-candle reversals. Morning star at the end of a downtrend; evening star at the top of an uptrend.
“The engulfing pattern dates back to 18th-century Japanese rice trading - the second candle ‘swallows’ the first, signalling a shift in control.” - Alan Tsagaraev
Use higher timeframes to cut noise and confirm patterns with volume or other indicators.
Reading Candlestick Signals
Trend Signals
Candlestick patterns reveal shifts in sentiment and potential reversals.
| Signal Type | Key Indicators | Confirmation |
|---|---|---|
| Bullish Reversal | Support levels, rising volume | Gap-up or strong green candle within 1-3 sessions |
| Bearish Reversal | Resistance levels, heavy volume | Gap-down or strong red candle confirmation |
| Continuation | Neutral volume, small bodies | Aligns with existing trend |
“Filtering candle patterns by trend and momentum greatly boosts reliability.” - John Murphy
Time & Volume Impact
Higher timeframes reduce noise and improve signal quality, while volume confirms conviction. If you want to stress-test a setup over thousands of scenarios, LuxAlgo’s AI Backtesting platform lets you load historical strategies instantly.
| Timeframe | Best For | Reliability | Drawbacks |
|---|---|---|---|
| Short-Term | Scalping - Day trading | Moderate | Noisy, more false signals |
| Medium-Term | Swing trading | High | Fewer setups |
| Long-Term | Position trading | Very high | Slow signals |
- Confirm patterns with RSI, MACD, or Bollinger Bands.
- Look for volume at least 2-3× average when a pattern forms.
- Use a top-down approach - higher timeframes for trend, lower for entries.
Trading with Candlesticks
Using Multiple Indicators
Candlestick analysis is most effective when paired with technical indicators. The Signals & Overlays™ toolkit offers adaptive confirmation and contrarian modes, while the OSC Screener highlights momentum divergences across multiple assets.
| Indicator | Function | How It Helps |
|---|---|---|
| Moving Averages | Trend direction | Identify dynamic support/resistance |
| RSI | Momentum | Spot overbought/oversold zones |
| MACD | Trend strength | Confirm momentum shifts |
| Bollinger Bands | Volatility | Highlight squeezes & breakouts |
| Stochastic | Price position | Show potential reversals via crossovers |
“Oscillators bring objectivity - they validate the message of candle patterns.” - Steve Nison
Managing Risk
A solid risk plan is non-negotiable. Define stops and position sizes before entering a trade. For deeper testing, the PAC Backtester lets you model different stop-loss placements on historical data.
| Risk Tool | Strategy | Key Point |
|---|---|---|
| Stop Loss | Use extremes of the pattern | Stops beyond high/low of pattern |
| Position Size | Volatility-scaled | Risk < 2% per trade |
| Trailing Stop | 3-candle rule | Update stop each new candle |
Summary & Next Steps
Candlestick analysis rewards consistent study and disciplined execution. Research on Taiwan’s exchange and Japan’s Nikkei 225 shows accuracy improves when patterns are paired with quantitative models. If you prefer a conversational workflow, the AI Backtesting Assistant can generate and test strategies involving candlestick triggers in seconds.
| Phase | Action Items | Success Metric |
|---|---|---|
| Build Foundation | Study historical charts | Correct pattern ID |
| Develop Strategy | Combine with indicators | Higher win rate |
| Manage Risk | Set stops & size | Controlled losses |
| Review & Adapt | Backtest & journal | Clear performance data |
Start with paper trading, track results, then transition to live trading with smaller positions. Consistency is key.
References
- LuxAlgo - Candlestick Structure Indicator
- LuxAlgo - Market Sentiment Technicals
- LuxAlgo Docs - Oscillator Matrix Reversal Signals
- LuxAlgo - Dynamic Support & Resistance
- LuxAlgo - Fibonacci Trailing Stop
- LuxAlgo - Price Action Concepts Indicator
- LuxAlgo - Signals & Overlays Indicator
- LuxAlgo Docs - Signals & Overlays Toolkit Intro
- LuxAlgo Docs - Oscillator Matrix Toolkit Intro
- LuxAlgo Docs - OSC Screener Intro
- LuxAlgo Docs - PAC Backtester Intro
- LuxAlgo - AI Backtesting Platform
- LuxAlgo Docs - AI Backtesting Assistant Intro
- Relative Strength Index - Wikipedia
- MACD - Investopedia
- Bollinger Bands - Wikipedia
- Nikkei 225 - Simple Wikipedia