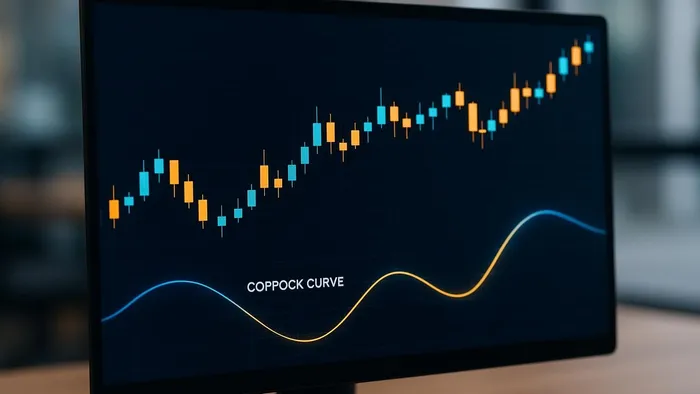

Explore the Coppock Curve, a long-term momentum tool that helps identify market bottoms and signals recovery for long-term investors.
The Coppock Curve is a long-term momentum tool used in technical analysis to identify market bottoms and potential buying opportunities in equity indices. It focuses on buy signals rather than sell signals, making it ideal for long-term investors navigating major market downturns. Created by Edwin Coppock in 1962, the tool uses monthly data to smooth out short-term fluctuations and highlight broader trends.
Key Takeaways:
- Purpose: Detects market bottoms and signals recovery periods after declines.
- Calculation: Combines 11-month and 14-month Rate of Change (ROC), smoothed with a 10-period Weighted Moving Average (WMA). See introductions to Rate of Change and Weighted Moving Average.
- Signals: A rising curve from negative territory or crossing above zero often indicates a market bottom.
- Applications: Best suited for broad indices like the S&P 500, Dow Jones, and NASDAQ.
- Limitations: Lags during rapid reversals, struggles in sideways markets, and lacks sell signals.
The Coppock Curve is most effective when paired with other tools, like moving averages or volume analysis, to confirm signals and refine strategies. It’s a patient investor’s guide to long-term market trends.
Coppock Curve Trading Strategy (Backtest & Rules)
How the Coppock Curve Works
The Coppock Curve simplifies raw price data into a smoothed momentum trend through a straightforward three-step process. By filtering out short-term market noise, it focuses on the long-term trends that are essential for making informed trading decisions.
Understanding how the Coppock Curve works can help traders interpret its signals with confidence. Based on Edwin Coppock's original research into market recovery cycles, the indicator is designed to highlight major market movements while ignoring short-term fluctuations. For a concise historical overview and classic usage, see StockCharts ChartSchool on the Coppock Curve.
Calculation Formula
The Coppock Curve relies on two rate-of-change (ROC) periods to generate its signals. Here’s how it’s calculated:
- Start with the 11-month ROC, which measures the percentage change between the closing price 11 months ago and the current price (intro to ROC: Investopedia).
- Calculate the 14-month ROC using the same method.
- Add these two ROC values together, then smooth the result using a 10-period weighted moving average (WMA) (WMA explained). This smoothing step ensures the indicator is responsive to recent data without being overly sensitive to short-term volatility.
For example, if the S&P 500 has an 11-month ROC of –8.5% and a 14-month ROC of –12.3%, the sum is –20.8%. This value, combined with similar historical data, is smoothed using the 10-period WMA to produce the final Coppock Curve.
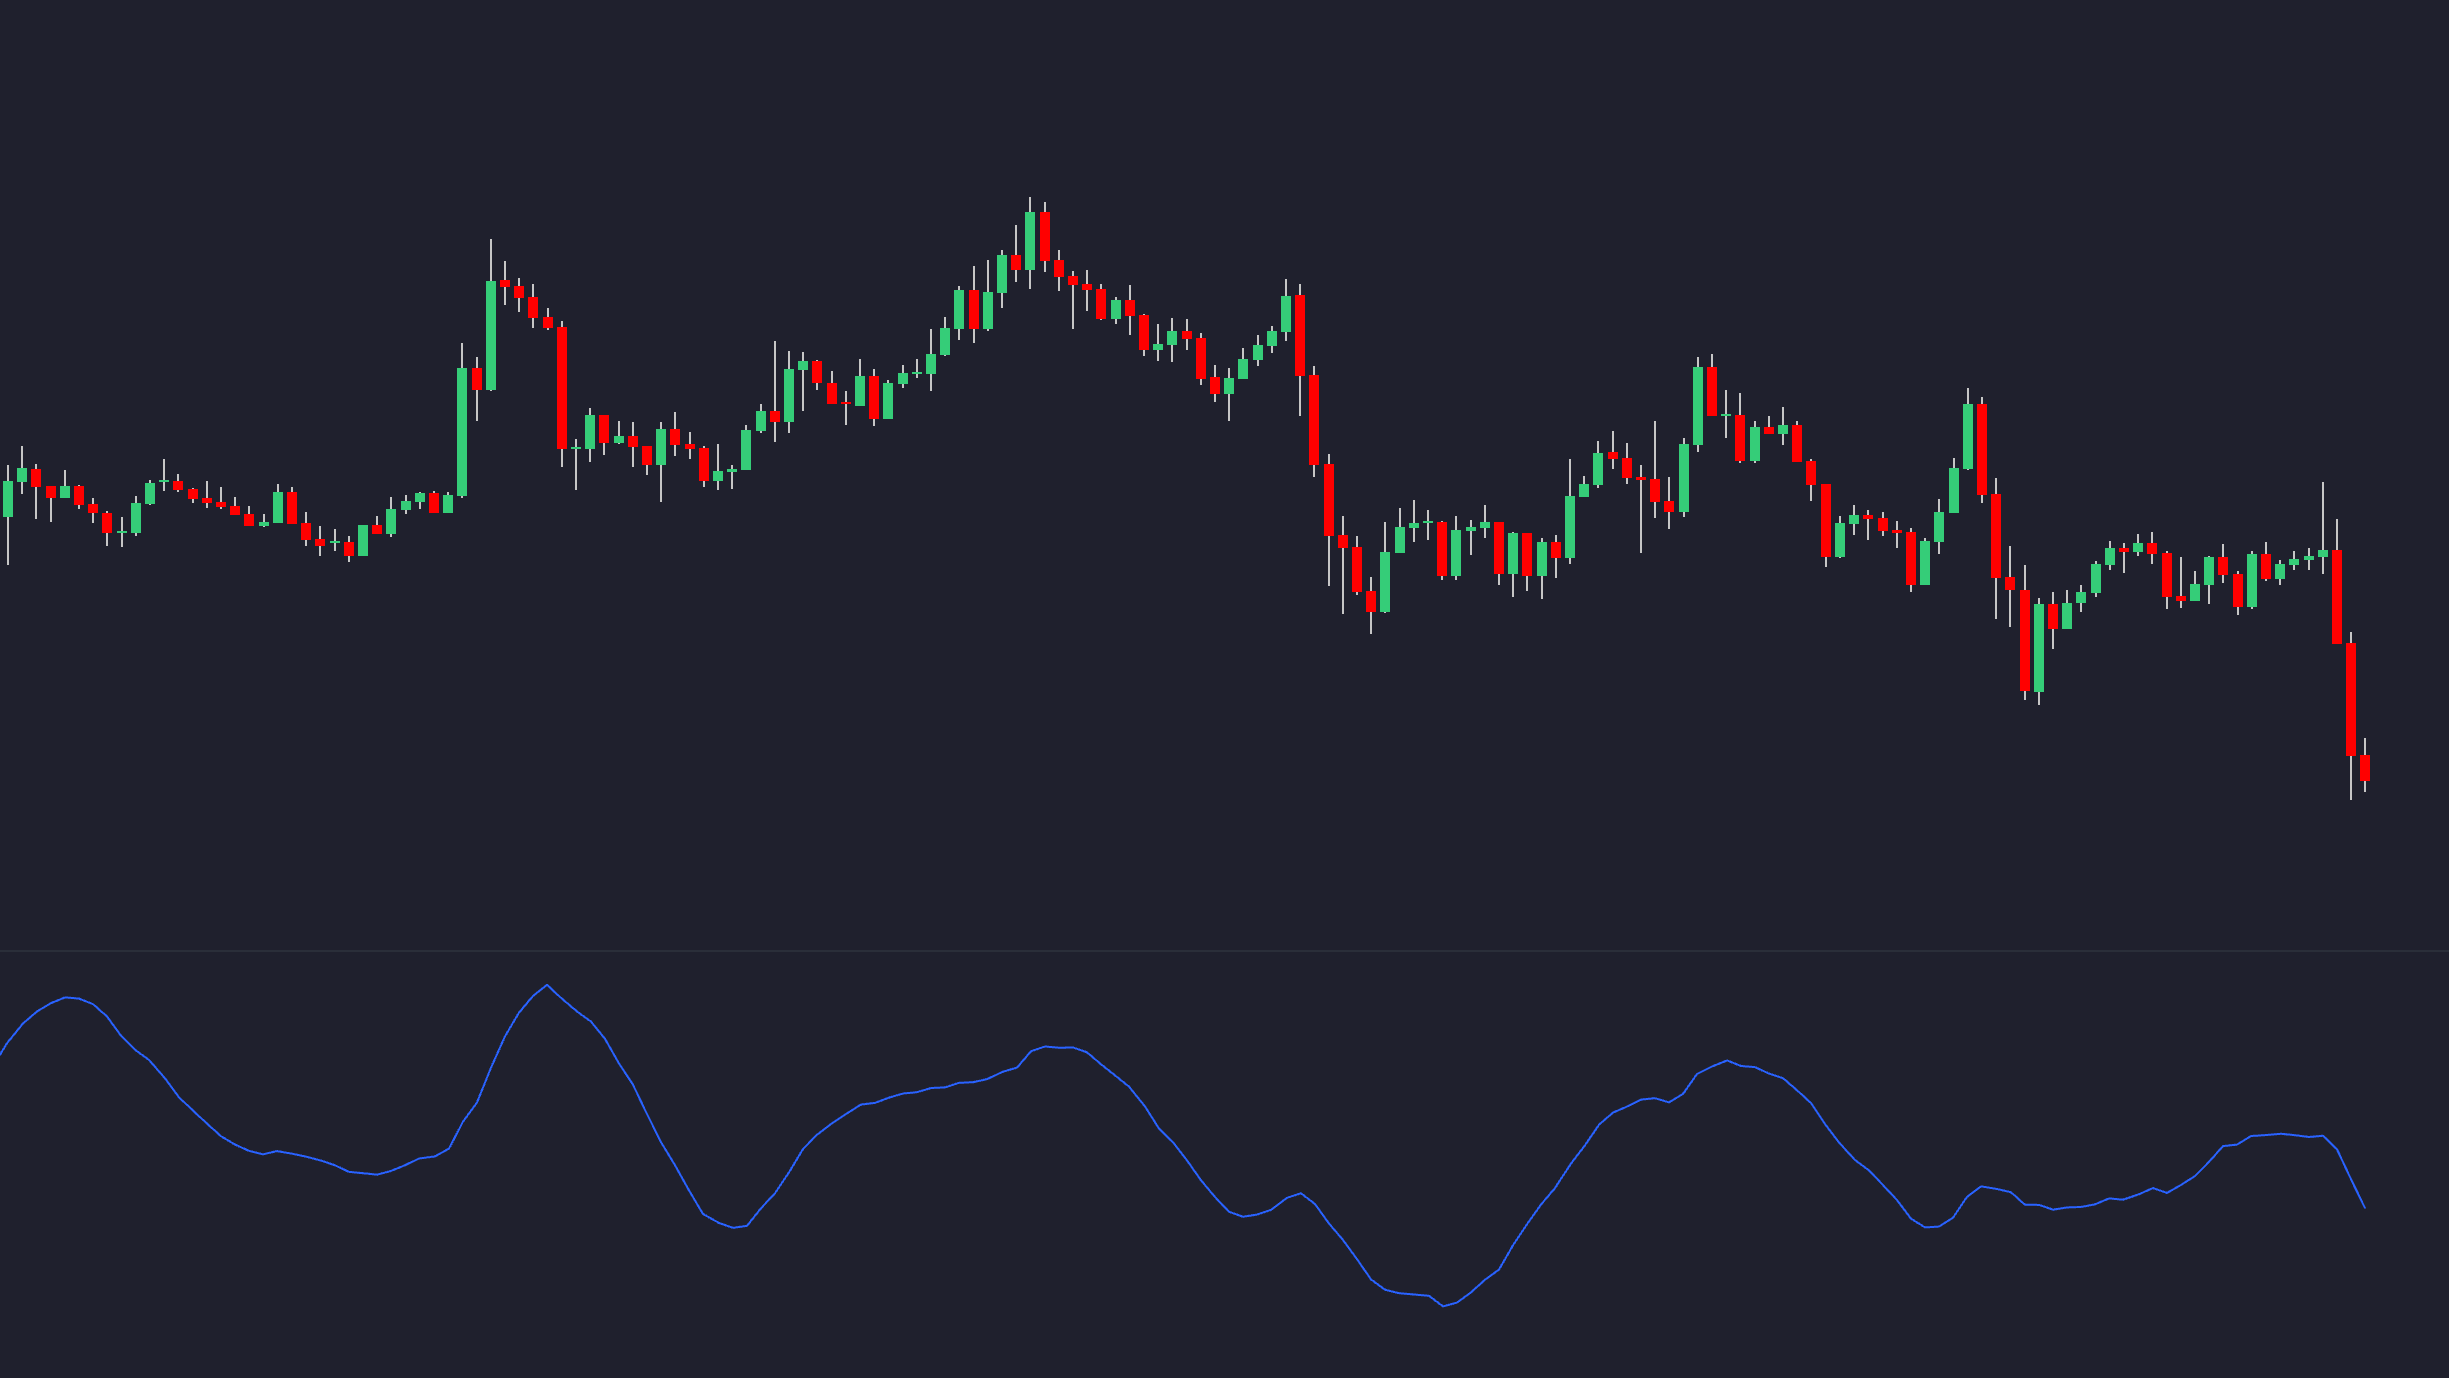
Reading the Curve Signals
The Coppock Curve signals shifts in market momentum by its movement relative to the zero line. One of its most important signals occurs when the curve turns upward after spending time below zero. This shift suggests that downward momentum is easing, potentially signaling favorable conditions for long-term buying.
A classic buy signal is generated when the curve crosses above zero, indicating that the combined rates of change have turned positive. Traders often look for earlier signs of a market rebound by watching for the curve to bottom out and start rising, even if it’s still below zero.
On the flip side, when the curve turns downward from positive territory or crosses below zero, it may indicate weakening long-term momentum. Because the Coppock Curve reacts at a deliberate pace, traders often wait for consistent directional shifts before making significant adjustments to their strategies. Historical examples provide further insight into how these signals play out in real-world scenarios.
Market Signal Examples
Historical market events show how the Coppock Curve can provide valuable context for understanding momentum shifts:
- 2008–2009 Financial Crisis: As the S&P 500 plummeted through 2008, the Coppock Curve dropped deeper into negative territory, reflecting extreme selling pressure. By early 2009, the curve began to reverse, signaling a market bottom. Later that year, it crossed above zero, confirming the start of a new bull market.
- Dot-Com Crash: During the extended downturn in the early 2000s, the Coppock Curve stayed negative as technology stocks struggled. In late 2002, the curve began to rise, offering an early indication of a recovery before the broader market rebounded.
- COVID-19 Crash (March 2020): The Coppock Curve plunged into deeply negative territory as markets fell over 30% in a matter of weeks. However, it quickly began to recover as fiscal and monetary stimulus stabilized prices. The curve’s rebound from its March lows helped confirm that the market downturn was temporary rather than the start of a prolonged bear market.
- 2022 Bear Market: As inflation concerns and rising interest rates weighed on equity markets, the Coppock Curve dipped into negative territory. Unlike the sharp declines of 2008 or 2020, this period reflected a slower, more gradual decline tied to fundamental economic pressures rather than panic selling.
These examples illustrate how the Coppock Curve can adapt to various market conditions, from rapid crashes to prolonged downturns, offering traders a tool to gauge long-term momentum shifts effectively.
Trading and Investment Applications
The Coppock Curve is a tool designed to pinpoint major market turning points, making it particularly useful for long-term investors and position traders. Professional money managers and institutional investors rely on its momentum signals to adjust portfolio allocations across stocks, bonds, and cash. This approach minimizes the noise of daily price swings and focuses on broader, long-term market trends. Let’s explore how this indicator can be applied in practical trading strategies.
Finding Market Bottoms
One of the Coppock Curve's strengths is its ability to identify market bottoms, signaling conditions that often precede significant recoveries. When the curve hits a low point and starts to rise, it suggests that selling pressure is easing and a market bottom may be forming. For patient investors, this early signal can provide opportunities to position themselves ahead of major rallies. Strategies like dollar-cost averaging can be particularly effective here, allowing gradual entry into the market during periods of weakness.
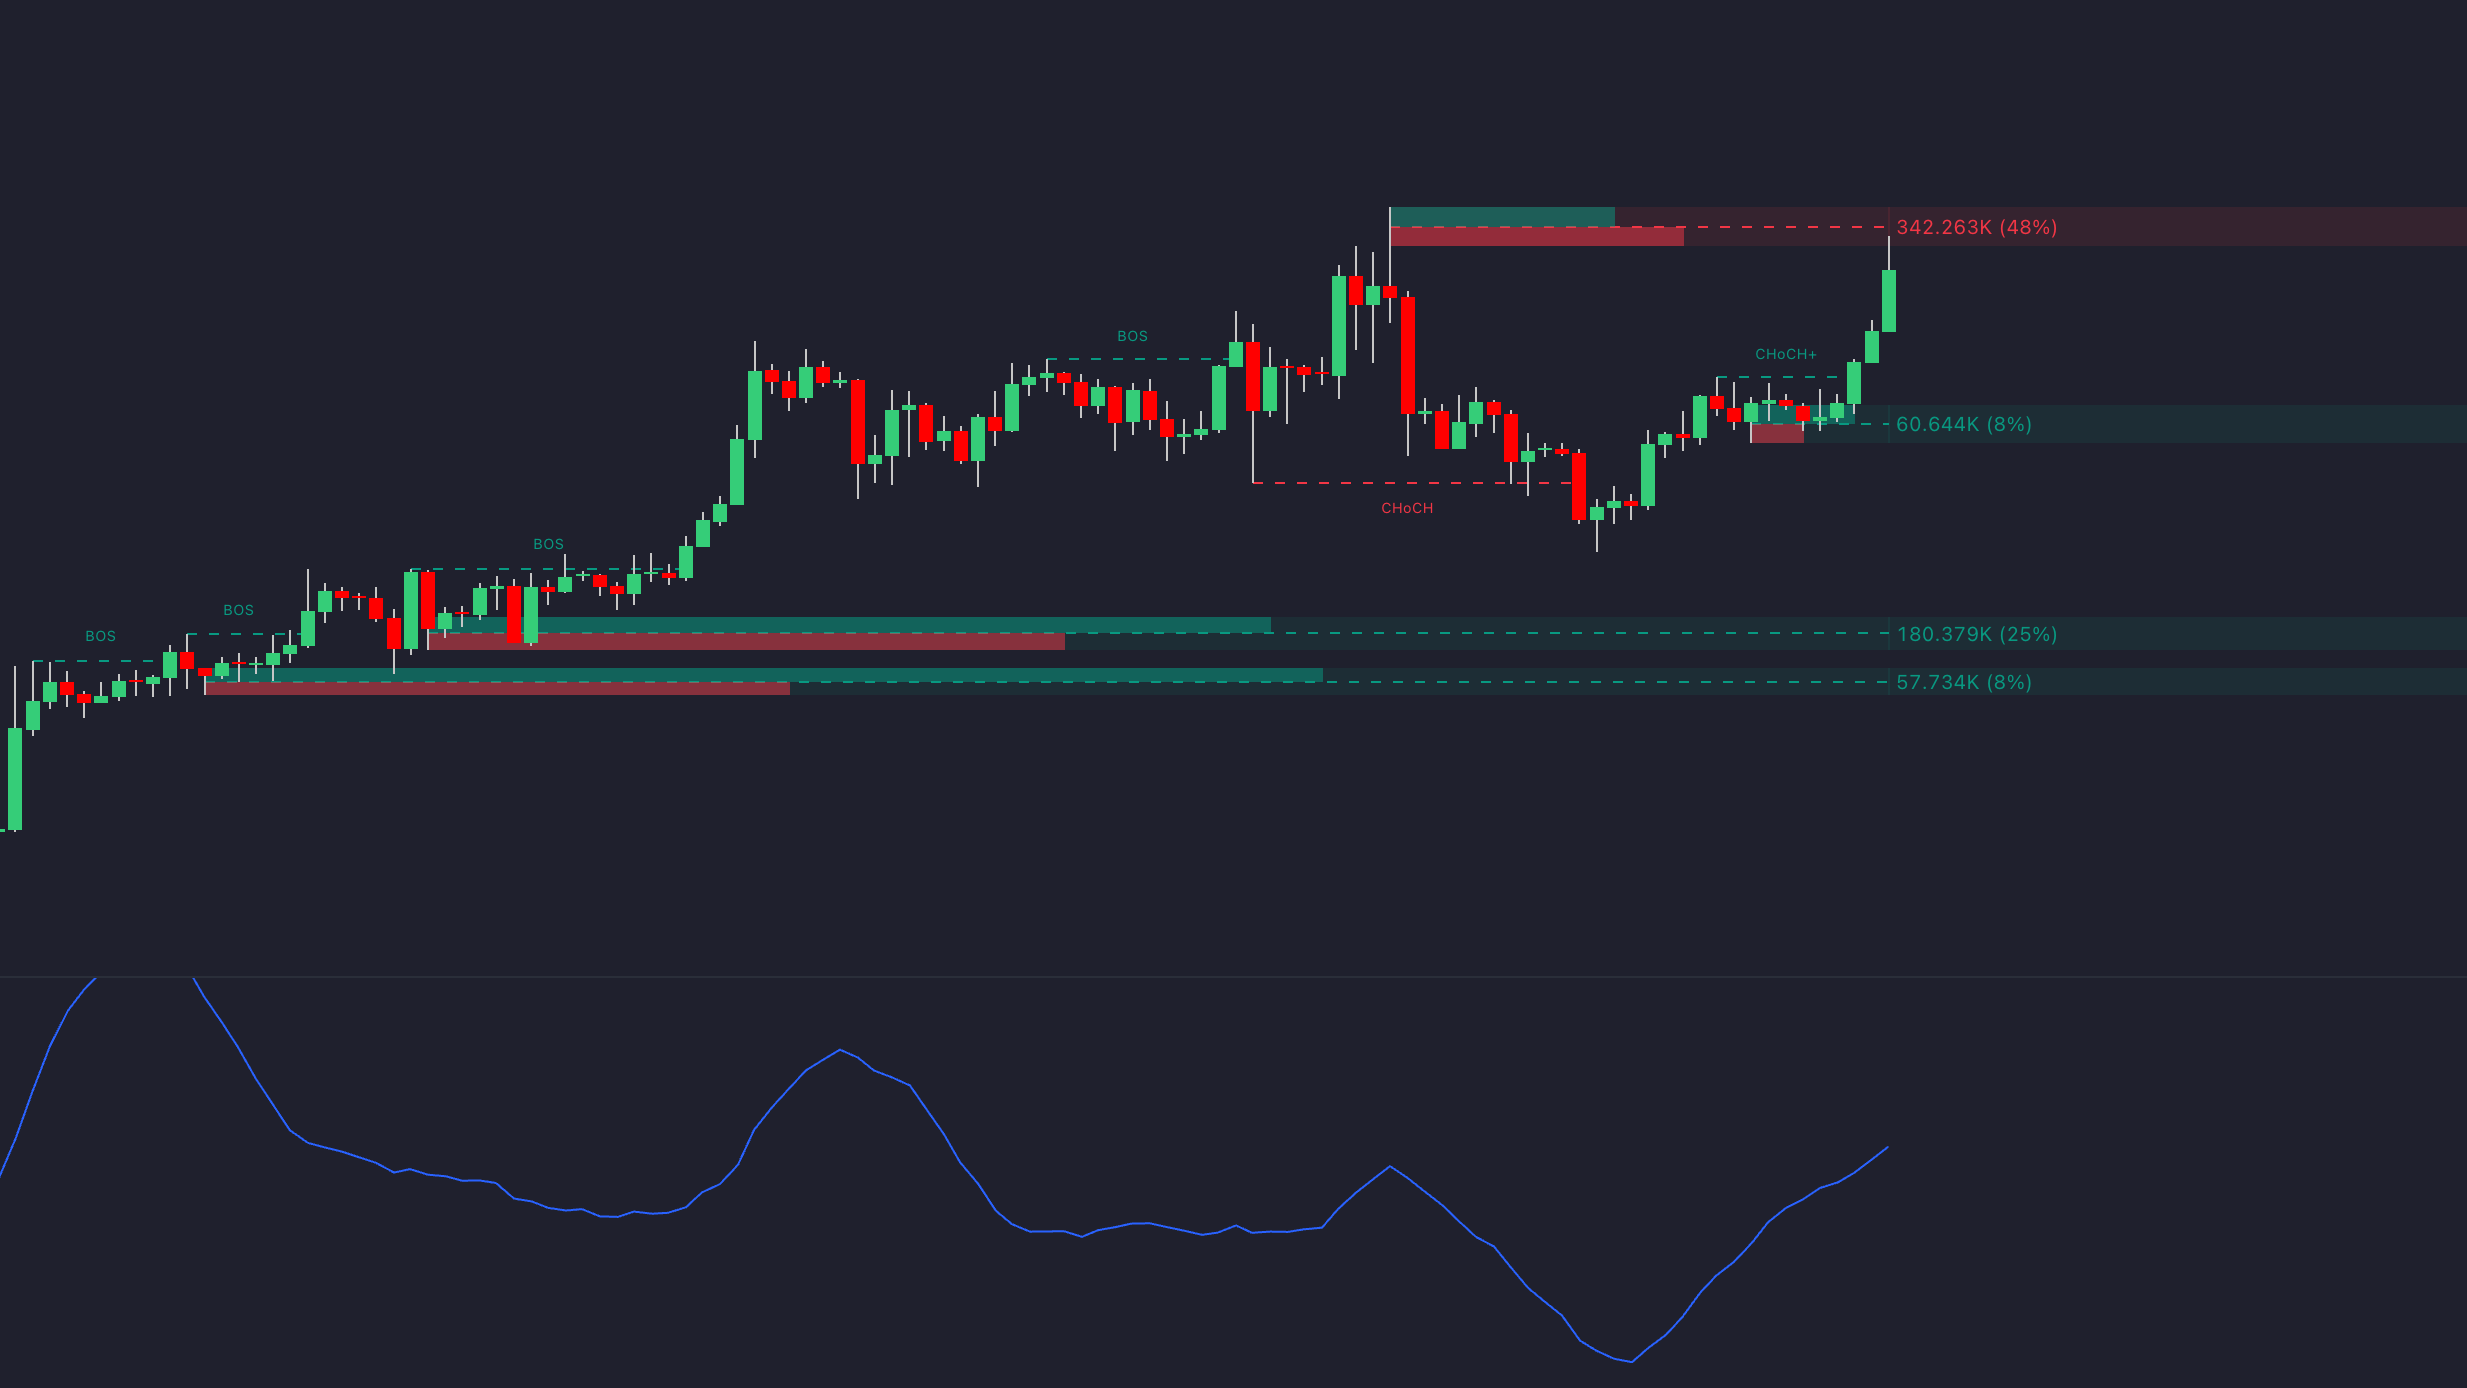
Combining with Other Technical Tools
The Coppock Curve becomes even more powerful when combined with other technical indicators. Here are a few that complement its signals:
- Moving Averages: Using moving averages, such as the 200-day average, helps confirm the direction of the trend and refine entry points.
- Volume Analysis: An upward turn in the Coppock Curve paired with increasing volume on up days strengthens the reliability of buy signals.
- Relative Strength Indicators: These can highlight sectors or stocks likely to outperform during bullish Coppock Curve signals.
- Support and Resistance Levels: These levels offer tactical entry and exit points, helping to fine-tune timing.
By integrating these tools, traders can make more informed decisions, particularly in U.S. equity markets.
U.S. Market Trading Tips
For traders focusing on U.S. markets, the Coppock Curve offers long-term signals that can guide strategic decisions. While the S&P 500 is often used as a benchmark, the indicator also works well with the Dow Jones Industrial Average and NASDAQ Composite.
Sector rotation strategies align seamlessly with Coppock Curve signals. During positive phases, cyclical sectors like industrials, materials, and financials often outperform, while defensive sectors may lag. Exchange-traded funds (ETFs) provide an efficient way to gain exposure to these sectors or broader market trends without the complexities of picking individual stocks (ETF basics from Investor.gov).
Since the Coppock Curve emphasizes long-term trends, its strategies naturally align with long-term capital gains treatment, offering potential tax advantages (IRS Topic 409: Capital gains and losses). Platforms like TradingView provide tools to overlay the Coppock Curve with other indicators, while advanced toolkits from LuxAlgo enable backtesting to refine strategies for different market conditions.
Risk management is essential when using the Coppock Curve. Adjust position sizes based on the strength of the indicator—larger positions during strong positive signals and smaller ones during negative phases. Implementing stop-loss orders tied to key Coppock Curve support levels ensures disciplined exits that align with the indicator’s methodology (order types overview).
Pros and Cons of the Coppock Curve
The Coppock Curve is a technical indicator with distinct strengths and weaknesses. While it excels at identifying long-term momentum trends, it may falter in fast-moving or sideways markets. To make the most of this tool, it's essential to weigh its benefits and limitations within the context of a broader trading strategy.
Key Benefits
One of the standout features of the Coppock Curve is its ability to smooth out short-term price fluctuations. By focusing on long-term trends, it helps investors identify underlying momentum without being distracted by daily market noise. This makes it particularly appealing for those with a long-term investment horizon.
Another advantage is its usefulness in confirming market bottoms. When combined with other analyses, the Coppock Curve can signal when selling pressure has likely peaked, offering a possible entry point for buyers. Its straightforward calculation also makes it accessible to a wide range of investors, regardless of experience level.
Main Limitations
However, the Coppock Curve is not without its drawbacks. Its reliance on historical price data means it often lags behind actual market movements. This delay can be a challenge during rapid market reversals, as traders may miss the initial phases of a trend change.
In markets that are range-bound or moving sideways, the Coppock Curve can generate unclear or conflicting signals, reducing its reliability. Additionally, since it was originally designed to identify buying opportunities, it does not provide sell signals, limiting its utility for timing exits or managing risk.
Periods of high volatility can also pose problems. The indicator may produce signals that quickly reverse, leading to premature trades. For this reason, it’s often best used alongside other technical tools to confirm its signals.
Advantages vs. Disadvantages Table
Here’s a quick summary of the Coppock Curve’s strengths and weaknesses:
| Advantages | Disadvantages |
|---|---|
| Smooths short-term price noise | Lags behind actual market turns |
| Helps confirm market bottoms | Struggles in sideways markets |
| Easy to calculate and interpret | Limited to buy signals |
| Prone to reversals in volatile periods | |
| May miss the early stages of trends | |
| Requires patience and discipline | |
| Not ideal for short-term trading |
Using the Coppock Curve with LuxAlgo
LuxAlgo provides trading indicators and AI-driven features designed to enhance long-term momentum strategies. The Library (free with a LuxAlgo account) offers many indicators across platforms, and Premium & Ultimate plans add advanced capabilities. These resources give traders a foundation for creating highly customizable indicators tailored to their needs.
Custom Coppock Curve Indicators
The LuxAlgo Library gives traders free access to customizable Coppock Curve indicators on popular platforms like TradingView, NinjaTrader, MetaTrader, and ThinkorSwim. These indicators let users tweak key parameters, such as rate-of-change settings and smoothing periods, to align with specific market conditions or timeframes. For instance, adjusting the weighted moving average period can generate quicker signals for intermediate-term trading or smoother trends for long-term analysis.
For those with a Premium subscription ($39.99/month), LuxAlgo unlocks advanced features like custom alerts and alert scripting. Traders can set automated notifications for when the Coppock Curve crosses above zero or hits defined momentum thresholds, eliminating the need for constant monitoring while staying tuned to critical signals.
Advanced Analysis with LuxAlgo Toolkits
LuxAlgo’s exclusive toolkits add another layer of technical validation to the Coppock Curve’s insights. The Signals & Overlays toolkit is particularly useful in volatile markets, helping to filter out false positives.
When the Coppock Curve suggests potential market bottoms, the Price Action Concepts toolkit enhances signal validation with volumetric order block analysis and automatic pattern detection. Meanwhile, the Oscillator Matrix toolkit brings real-time divergence detection into the mix, complementing the Coppock Curve’s momentum-based analysis. Together, these tools streamline the process of validating buy signals and screening assets like stocks and ETFs across various sectors.
AI Backtesting and Strategy Testing
LuxAlgo also empowers traders with advanced AI backtesting capabilities. The Ultimate plan ($59.99/month) includes access to the AI Backtesting Assistant, a web-based platform that evaluates Coppock Curve strategies across multiple tickers and timeframes using decades of historical data. See the AI Backtesting Assistant docs for details.
This platform allows traders to experiment with different Coppock Curve configurations to identify which setups perform best for specific asset classes. The AI engine automatically fine-tunes signal parameters and delivers in-depth performance metrics, such as maximum drawdown, Sharpe ratio, and win rates (background on the Sharpe ratio). It also tests thousands of parameter combinations to uncover better-performing strategies. For example, traders might discover optimized configurations that outperform the default Coppock Curve settings for certain markets.
Ultimate subscribers also receive weekly reports featuring pre-tested strategies that combine the Coppock Curve with other LuxAlgo indicators. These reports include backtesting results and implementation tips, helping traders stay ahead of market trends and refine their long-term momentum strategies.
To top it all off, LuxAlgo offers 24/7 live support, ensuring that traders can quickly resolve technical issues or get assistance with strategy implementation. This makes advanced tools and backtesting accessible, even for those new to quantitative analysis.
Using the Coppock Curve for Long-Term Trading Success
The Coppock Curve is a trusted tool for spotting major turning points in the U.S. market and identifying shifts in long-term momentum. It’s particularly useful for timing market entries during periods of decline, helping traders position themselves for potential gains when the market begins to recover.
To make the most of this indicator, patience and discipline are key. The Coppock Curve is designed to track broader market trends, not short-term fluctuations. It performs best when viewed on a monthly timeframe, which means traders may need to wait weeks—or even months—for actionable signals to emerge.
The indicator’s strength lies in its simplicity. Historically, it has provided clear buy signals when it moves from negative to positive territory, guiding traders through the ups and downs of market cycles over the years.
For those looking to refine their strategy, pairing the Coppock Curve with modern tools can be a game-changer. Algorithmic backtesting, for example, allows traders to fine-tune sensitivity settings for different market conditions. Additionally, combining it with other tools like trend confirmation or divergence analysis can help validate signals and manage risk more effectively.
FAQs
How does the Coppock Curve stack up against other long-term momentum indicators in terms of reliability?
The Coppock Curve stands out for its ability to pinpoint major market trends and shifts in long-term momentum. Unlike tools like RSI or MACD, which cater more to short-term analysis, the Coppock Curve is tailored to cut through short-term market noise and focus on extended market cycles. This makes it an excellent resource for investors looking to understand broader market movements.
What sets it apart is its smoothing effect, which emphasizes meaningful trend changes while filtering out minor fluctuations. While it’s not ideal for short-term trading, it shines when used to gain a clearer view of long-term market direction, making it a go-to tool for strategic investment planning.
Can the Coppock Curve be used effectively in international markets, and what adjustments might be needed?
Yes, the Coppock Curve works well for markets outside the U.S., especially when used on a monthly time frame to spot major market bottoms and trend reversals. However, some tweaks might be needed to improve its accuracy for different markets.
These adjustments could involve changing the rate of change periods or smoothing parameters to align with the specific traits of the target market, like its volatility or economic patterns. By fine-tuning these settings, the Coppock Curve can deliver valuable insights, aiding traders and investors in making well-informed decisions.
How can I combine the Coppock Curve with other technical indicators to improve its accuracy in different market conditions?
To make the Coppock Curve more reliable, consider blending it with other technical indicators like RSI, moving averages, or Bollinger Bands. For instance, if the Coppock Curve is trending upward while the RSI dips below 30, it could signal a strong buying opportunity in an oversold market.
Using the Coppock Curve alongside moving averages can also confirm longer-term trends, helping to minimize the risk of false signals. Meanwhile, Bollinger Bands add insight into market volatility, making it easier to spot potential reversals. Combining these tools allows traders to navigate different market scenarios with greater confidence and make more well-rounded trading decisions.
References
LuxAlgo Resources
- Understanding Moving Averages and How Traders Use Them
- Volumetric Toolkit
- Adaptive Momentum Oscillator
- Market Structure Intrabar (LuxAlgo)
- Reversal Signals (OSC)
- LuxAlgo Homepage
- Signals & Overlays: Alerts
- Alert Scripting – Update & Actions
- PAC: Order Blocks (Volumetric)
- Triangular Momentum Oscillator – Real-Time Divergences
- AI Backtesting Assistant
- AI Backtesting Assistant – Docs
- S&O Backtester
- PAC Backtester
- Bollinger Bands Breakout Oscillator


