
Explore the Directional Movement Index (DMI) for effective trend analysis, trading strategies, and enhancing market decision-making.
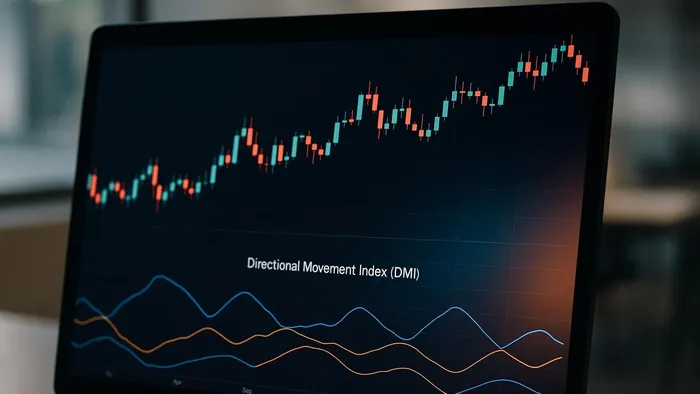
The Directional Movement Index (DMI) is a technical indicator used by traders to measure the strength and direction of market trends. Developed by J. Welles Wilder in 1978, it consists of three components:
- +DI (Positive Directional Indicator): tracks upward momentum.
- –DI (Negative Directional Indicator): tracks downward momentum.
- ADX (Average Directional Index): shows the strength of the trend, regardless of its direction.
Quick Takeaways
- When +DI > –DI: upward trend → potential buy.
- When –DI > +DI: downward trend → potential sell.
- ADX > 25: strong trend.
- ADX < 20: weak or no trend.
The DMI helps traders focus on strong trends while avoiding false signals in choppy markets. Pairing it with tools such as moving averages or RSI can improve accuracy and decision-making.
Measure Trend Strength Using the Market Directional Movement Index – DMI
DMI Components Explained
These three components work together to give traders a clear view of market trend strength, making it easier to analyze trends effectively.
Positive and Negative Directional Indicators (+DI and –DI)
The +DI and –DI lines are the core of the DMI system, tracking the direction of price movements. Together, they help identify both direction and intensity of market moves.
- +DI measures upward momentum by comparing today’s high to yesterday’s high, signaling bullish pressure.
- –DI measures downward momentum by comparing today’s low to yesterday’s low, reflecting bearish pressure.
When the +DI is higher than the –DI, it indicates buying pressure, while a –DI above +DI signals selling pressure. The wider the gap, the stronger the trend.
Average Directional Index (ADX)
The Average Directional Index (ADX) serves as the strength gauge of the DMI system, measuring how strong a trend is—regardless of its direction.
| ADX Value | Trend Strength |
|---|---|
| 0 – 25 | Weak or No Trend |
| 25 – 50 | Strong Trend |
| 50 – 75 | Very Strong Trend |
| 75 – 100 | Extremely Strong Trend |
An ADX above 25 points to a strong trend, while values below 20 suggest a weak or nonexistent trend.
Wilder’s Smoothing Technique
J. Welles Wilder designed a smoothing method to reduce short-term noise on DMI components. This technique smooths the +DM, –DM, and True Range values over 14 periods and is also used for the Average True Range (ATR).
DMI Calculation Steps
Turning raw price data into actionable indicators involves three key calculations: True Range (TR), Directional Movement (DM), and the ADX.
Calculating the True Range (TR)
The True Range captures actual price movement—including gaps—by picking the largest value among:
- Current High − Current Low
- Current High − Previous Close
- Current Low − Previous Close
Computing Directional Movement (+DM and –DM)
+DM focuses on upward price movement, –DM on downward. Both are smoothed over 14 periods before producing +DI and –DI.
Calculating the ADX
The ADX is a smoothed average of the Directional Index (DX) values and ranges from 0 to 100. Values > 25 suggest trend strength.
Reading DMI Signals for Trend Analysis
ADX Levels and Trend Strength
| ADX Value | Trend Strength | Market Condition |
|---|---|---|
| 0 – 20 | Absent/Weak | Sideways |
| 25 – 50 | Strong | Trending |
| 50 – 75 | Very Strong | Powerful Move |
| 75 – 100 | Extremely Strong | Rare |
Trading +DI and –DI Crossovers
Crossover signals are most reliable when the ADX is above 25.
ADX Slope and Momentum Changes
A rising ADX slope suggests growing momentum; a falling slope warns of potential reversals.
DMI Trading Strategies
Use the ADX to filter high-probability trades, confirm breakouts, and coordinate strategy backtests with LuxAlgo’s AI Backtesting platform. New users can review the Backtesting Assistant documentation to learn how to generate and test strategies automatically.
Using ADX to Filter Trade Entries
When ADX > 25, trend-following strategies shine. Below 20, many traders switch to range-bound tactics. In backtests, breakout strategies paired with ADX filters and trailing stops have produced robust returns.
Spotting Divergences with +DI and –DI
Divergences gain reliability when confirmed by the Oscillator Matrix’s reversal signals.
Multi-Timeframe DMI Analysis
Align higher-timeframe trends with precise lower-timeframe entries. The Signals & Overlays Toolkit, Price Action Concepts Toolkit, and Oscillator Matrix Toolkit each offer overlay signals that integrate seamlessly with multi-timeframe DMI analysis.
DMI Trading Examples
Example 1: Trend Reversal on EUR/USD
The pair signaled reversal when –DI strengthened and price sliced through support. Traders confirmed with LuxAlgo candle-coloring overlays.
Example 2: Trend Continuation on SPY
In long-term backtests from 1993, +DI / –DI crossovers on SPY paired with rising ADX showed a 76 % win rate. Strength spikes were double-checked with the Oscillator Matrix before scaling in.
Example 3: Low Volatility on BTC/USD
When ADX fell below 20, BTC traded in a range. Traders shifted to dynamic support-and-resistance levels to fade range extremes.
Using DMI for Better Trend Analysis
The DMI excels at filtering for meaningful momentum. On higher timeframes (H1+), its signals become even more dependable. Combine it with moving averages, RSI, or MACD for multi-indicator confluence.
FAQs
How can traders combine the Directional Movement Index (DMI) with other indicators to make better trading decisions?
Pair the DMI with indicators such as RSI or MACD. For instance, when DMI shows a strong trend and RSI signals overbought, a potential reversal may be brewing.
How does the DMI perform in trending vs. range-bound markets, and how can traders adapt their strategies?
In trending markets, watch +DI / –DI crossovers and a rising ADX. In ranges, traders lean on support-and-resistance tools (e.g., Range Detector) and tighter stops to avoid whipsaws.
How does the Average Directional Index (ADX) help traders evaluate market trends, and what do different ADX levels indicate?
An ADX below 20 hints at a range, above 25 flags a trend, and above 50 shows exceptional momentum. Review the Backtesting Assistant strategy fetch to see how ADX filters improve performance in historical tests.
References
- Understanding Moving Averages – LuxAlgo Blog
- Range Detector
- Range Average Retest Model
- Breakouts with Tests & Retests
- Fibonacci Trailing Stop
- Reversal Spotting Made Easy – LuxAlgo Blog
- Oscillator Matrix – Reversal Signals
- Signals & Overlays – Candle Coloring
- Support & Resistance Dynamic
- Backtesting Assistant – Fetching Strategies
- AI Backtesting Platform
- AI Backtesting Assistant Documentation
- Signals & Overlays Toolkit Overview
- Price Action Concepts Toolkit Overview
- Oscillator Matrix Toolkit Overview


