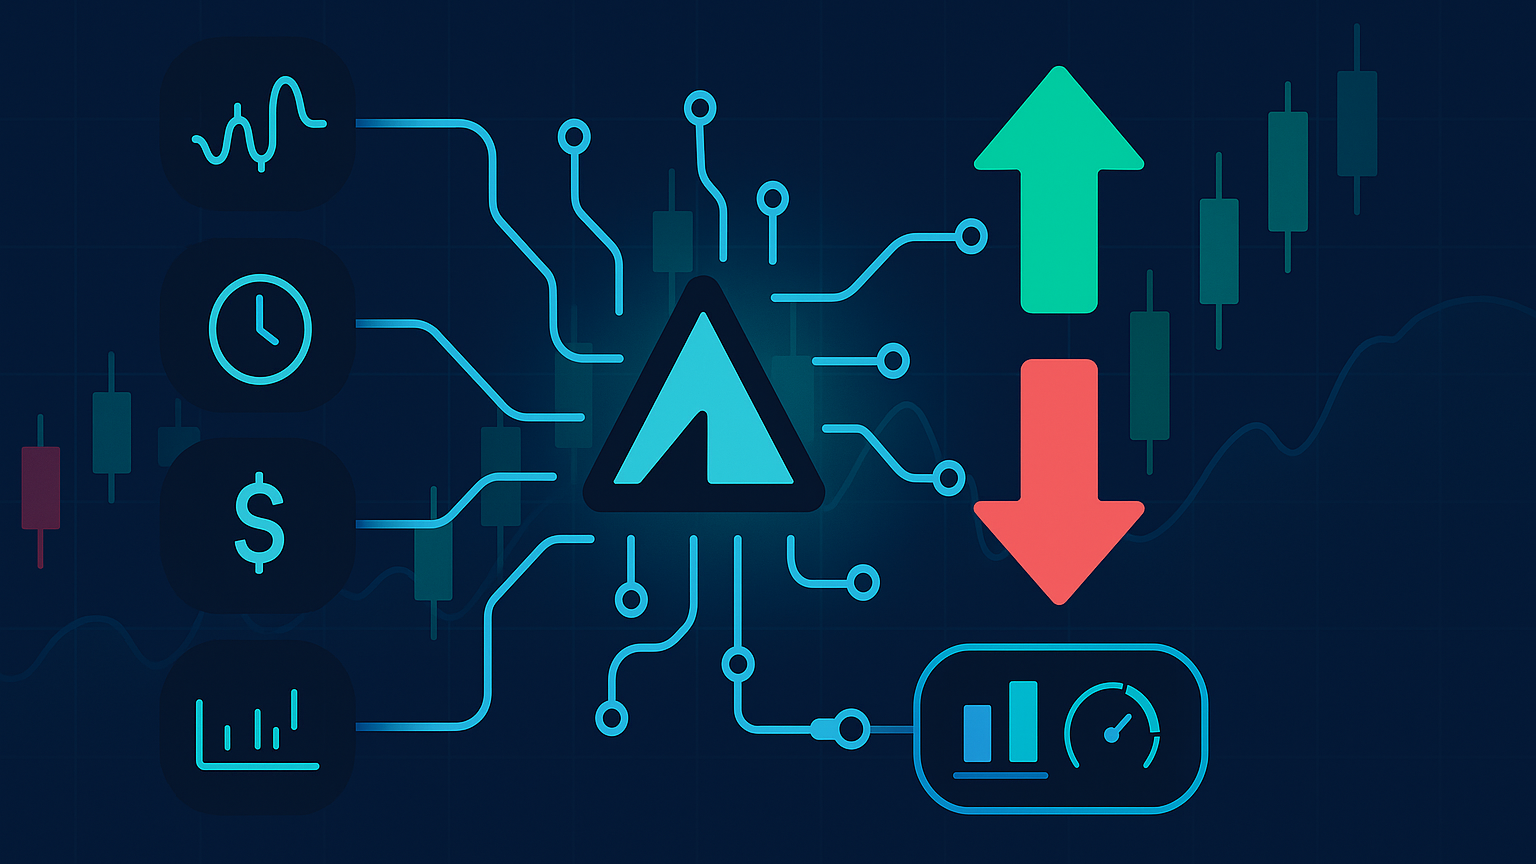
Explore how feature engineering transforms trading data into insights, enhancing decision-making through advanced analytics and machine learning techniques.
Feature engineering in trading transforms raw market data into actionable insights, helping traders make better decisions. Here's what you need to know:
- Core Idea: Convert data like prices and volumes into predictive signals for trading algorithms.
- Key Techniques: Time series analysis, technical indicators (e.g., MACD, RSI), and machine learning models like SVMs and CNNs.
- Data Quality Matters: High-quality data (accuracy > 98%, latency < 100 ms) is critical for reliable results.
- Common Challenges: Handling unstructured data (about 80% of financial data) and ensuring consistency across formats.
- Tools and Platforms: Use APIs, libraries such as TA-Lib, and platforms like TradingView for seamless integration.
Quick Comparison of Key Methods
| Feature Type | Accuracy Range | Best Use |
|---|---|---|
| Price Trends (SVM) | 65 – 85 % | Identifying historical trends |
| Pattern Recognition (CNN) | 70 – 90 % | Spotting chart patterns |
| Moving Averages (SMA/EMA) | N/A | Tracking long-/short-term trends |
Feature engineering bridges the gap between raw data and smarter trading strategies. Whether you're a beginner or an advanced trader, mastering these techniques can enhance your decision-making and results.
Algorithmic Trading: Machine Learning & Quant Strategies
Market Data Fundamentals
Market data is the backbone of effective feature engineering in trading. Your ability to produce meaningful trading signals hinges on understanding various data types and upholding strict quality standards.
Market Data Categories
Trading platforms handle several types of market data, each offering a different level of detail. Level 1 data includes basic information like price, bid/ask, and volume, while Level 2 data digs deeper, providing insights into order book depth and market-maker activity. Consolidated Tape data (often referred to as SIP data) compiles national market information, and proprietary data can deliver more detailed insights, such as advanced liquidity metrics.
| Data Type | Information Provided | Common Applications |
|---|---|---|
| Level 1 | Basic price, bid/ask, volume | Day trading, basic analysis |
| Level 2 | Order book depth, market-maker data | Advanced trading strategies |
| Consolidated Tape | National market data (SIP) | Data aggregation, oversight |
| Proprietary | Enhanced liquidity data | High-frequency trading |
Market data delivery has become much faster over the years. For example, the Securities Information Processors (SIP) cut trade-reporting latency for Tape A and B securities from 6.46 ms in Q1 2010 to just 0.15 ms by February 2018.
Data Quality Standards
Reliable feature engineering depends on high-quality data. Poor data quality can harm trading performance and cost more than 25% of firms over $5 million annually. To ensure data integrity, consider these best practices:
- Monitor feature distribution to detect anomalies.
- Retrain models regularly to align with current market conditions.
- Use immutable data resources to prevent tampering.
- Keep detailed feature logs for traceability.
Common Data Problems
Financial data comes in overwhelming volumes and varying formats. Roughly 80% of this data is unstructured, appearing in PDFs, emails, and similar formats. This complexity can disrupt feature-engineering workflows. One firm reportedly saved $400 000 per year by improving its data-handling processes, and experts estimate that better data management can cut market-data costs by 10 – 30 %.
To address these issues, you can:
- Use automated data-validation tools to catch errors early.
- Consolidate data-warehousing systems for streamlined access.
- Maintain strict version control for all data sources.
- Conduct regular audits to evaluate data quality.
- Standardize formats to ensure consistency across systems.
Basic Feature Engineering Methods
These methods convert raw data into specific inputs for predictive models, which are essential in modern trading strategies.
Time Series Features
Time-series analysis plays a key role in crafting trading features. By analyzing historical price patterns, traders can generate predictive inputs. For instance, lagged features use past price data to predict future movements.
Moving averages are another popular tool for identifying trends while reducing market noise:
| Moving Average Type | Characteristics | Best Use Case |
|---|---|---|
| Simple Moving Average (SMA) | Equal weight to all periods | Identifying long-term trends |
| Exponential Moving Average (EMA) | More weight on recent data | Tracking short-term momentum |
| Weighted Moving Average (WMA) | Custom weights for periods | Analyzing specific trends |
Standard Trading Indicators
Technical indicators help identify market momentum and potential reversals. Studies suggest that combining these indicators with machine learning can enhance trading outcomes.
"Time series analysis attempts to understand the past and predict the future." – QuantStart
Some widely used indicators include:
- MACD (Moving Average Convergence Divergence): Performs exceptionally well when paired with GRU networks.
- RSI (Relative Strength Index): While moving averages reveal the trend, RSI highlights its strength and potential reversals.
- Bollinger Bands: These bands adjust automatically to market conditions, helping traders spot volatility patterns and breakout opportunities.
Volume and Price Volatility
Volume-based features provide critical insights into market dynamics:
- On-Balance Volume (OBV): Tracks buying and selling pressure.
- Chaikin Money Flow: Measures accumulation and distribution trends.
- Klinger Oscillator: Evaluates trend strength.
Research shows that 60 – 70 % of Volatility Contraction Pattern (VCP) breakouts result in significant price rallies when accompanied by strong volume.
- Rising markets with increasing volume signal strength, while falling prices with high volume suggest strong downward momentum.
- Volume declines during successive price contractions often precede breakouts.
- High-volume breakouts can lead to gains of 20 – 100 % in the following months.
- Decreasing volume at new price extremes may indicate potential reversals.
Advanced Data Processing
Machine-learning and data-science techniques uncover patterns that help generate accurate trading signals.
Machine Learning Features
LuxAlgo incorporates machine learning within its advanced indicators and AI Backtesting platform to improve market analysis. Here's how:
- SVM (Support Vector Machine): Predicts trends with an accuracy of 65 – 85 %.
- CNN (Convolutional Neural Network): Spots chart patterns with 70 – 90 % accuracy.
- LSTM (Long Short-Term Memory): Aids momentum analysis, yielding around 25 % annual returns.
- Other Neural Networks: Pinpoint arbitrage opportunities with up to 99.9 % accuracy.
Deep-learning models can also adjust bid-ask spreads in real time, enabling more than 10 000 trades per day with steady profits. These approaches rely on efficient data-reduction techniques to maintain performance.
Data Reduction Methods
Techniques like Principal Component Analysis (PCA) streamline data while preserving effectiveness in financial modeling. Other methods include:
- Sampling + Ensemble: Boosted F1 scores by 0.23.
- Data Thinning Recovery: Improved results in 27 of 30 stocks, with an index gain of 3.42 % over three months.
Feature Combination Strategies
Combining data from multiple sources strengthens market analysis. For example:
- Named Entity Recognition processes news articles.
- Text Classification analyzes financial reports.
- Time Series Analysis assesses market data.
- Topic Modeling evaluates social media trends.
Random-forest algorithms excel in mean-reversion strategies, identifying short-term price deviations in related assets and achieving an average return of about 15 % per trade.
Key risk factors to monitor include:
- Value at Risk: Calculated using Monte Carlo simulations.
- Beta Exposure: Measured through regression analysis.
- Volatility Risk: Evaluated with GARCH models.
- Concentration Risk: Identified via clustering algorithms.
- Liquidity Risk: Assessed with time-series analysis.
Finally, integrate APIs from trusted data vendors to collect and clean data, ensuring accuracy and reducing errors.
Setting Up Feature Engineering
Platform Integration
TradingView and LuxAlgo are popular choices for incorporating feature engineering into trading systems. TradingView's API allows users to integrate custom indicators and automate strategies seamlessly. With support from over 100 million traders and access to real-time data, it’s a go-to platform for many.
LuxAlgo offers exclusive tools designed specifically for advanced feature engineering:
- Price Action Concepts (PAC): Automates pattern detection and evaluates market structure.
- Signals & Overlays (S&O): Processes multiple signal algorithms at once for better decision-making.
- Oscillator Matrix (OSC): Calculates real-time divergences efficiently.
"Find all your tools in one place. Standard and custom indicators sit alongside advanced screeners and a live news feed, meaning you can trade effectively without switching platforms." – OANDA on TradingView
Processing Speed Options
The speed at which your system processes data depends on your trading strategy. Here's a comparison of common methods:
| Method | Best For | Performance Impact |
|---|---|---|
| Live Calculation | Day trading, scalping | Sub-second response, higher resource usage |
| Pre-processing | Swing trading, position trading | Faster execution, lower real-time demands |
| Hybrid Approach | Mixed strategies | Balanced performance, moderate resource usage |
For faster processing, the Bytewax Python API, built on Rust, can outperform standard Python implementations. Remember, however, that speed improvements must be paired with robust error-prevention practices.
Error Prevention
Accurate feature engineering relies on minimizing errors that could distort predictive models. Focus on these key areas:
- Data Quality Assurance
Validate your data during pre-processing. LuxAlgo’s Premium plan (US $39.99 per month) provides advanced signals, alerts and oscillator tools that help monitor data quality. - Feature Validation
Test new features against historical data using LuxAlgo’s AI Backtesting Assistant, which has helped traders generate profits even with smaller balances. - System Monitoring
Track your feature-engineering pipeline in real time. TradingView delivers consistent performance across desktop, browser and mobile platforms.
- Verify data acquisition.
- Check feature-calculation accuracy.
- Measure processing speed.
- Monitor model performance.
- Log errors in real time.
Testing Feature Performance
Backtesting Process
Backtesting is essential for validating engineered features. LuxAlgo’s AI Backtesting Assistant evaluates strategies across varied market scenarios.
- Data Preparation
Clean and format historical data, and include synthetic data generated from agent-based models for broader scenarios. - Feature Validation
Test each feature individually and in combination. LuxAlgo’s Premium plan provides tools for optimizing signal settings and running thorough backtests. - Performance Analysis
Assess performance under changing market conditions. For advanced users, the Ultimate plan (US $59.99 per month) offers weekly automated backtests and optimization tools.
Success Metrics
| Metric | Target Range | Description |
|---|---|---|
| Sharpe Ratio | > 0.75 | Risk-adjusted returns versus volatility |
| Profit Factor | > 1.75 | Gross profits versus gross losses |
| Maximum Drawdown | < 20 – 25 % | Largest decline from a peak |
| CAR / MDD | Variable | Compound annual return to maximum drawdown |
Market Condition Updates
- Continuous Monitoring
Use LuxAlgo’s Oscillator Matrix toolkit to track real-time divergences, pinpointing when feature performance begins to slip. - Dynamic Adjustments
Adjust feature weights in line with current market conditions, combining signals and forecasts to manage position sizing. - Regular Recalibration
Update feature parameters with the AI Backtesting Assistant to keep your strategy effective as markets evolve.
Next Steps
Key Advantages
Feature engineering turns raw market data into insights that improve trading performance. When done right, it enhances model accuracy and simplifies decision-making.
- Faster processing and easier model maintenance
- Better responsiveness to market shifts
- Improved signal clarity by minimizing noise
- More accurate representation of available data
Getting Started
Kick off your feature-engineering efforts with these trusted tools:
| Tool | Purpose | Key Feature |
|---|---|---|
| TA-Lib | Technical analysis | Pre-built market indicators |
| Featuretools | Automated engineering | Deep feature synthesis |
| TSFresh | Time-series processing | Advanced pattern detection |
| PyKalman | Signal processing | Noise-reduction filters |
"Machine learning has transformed trading, turning manual processes into sophisticated automated systems that analyze market data, detect patterns, and execute trades with unprecedented speed and accuracy." – TradeFundrr
To get started, follow these steps:
- Data Collection: Gather high-quality data from diverse market sources.
- Feature Creation: Use libraries like NumPy and pandas for basic transformations.
- Signal Validation: Perform robust backtesting with frameworks such as Zipline.
- Performance Monitoring: Track metrics and analyze factors with libraries like Alphalens.
Learning Resources
- Quantopian Community: Free educational content and backtesting tools.
- Feature Engine Documentation: Tutorials on advanced feature-selection techniques.
- TSFresh Guides: Detailed resources on time-series feature extraction.
The Knight Capital incident in 2012, which resulted in a US $440 million loss due to algorithmic errors, underscores the importance of rigorous testing and continuous learning in feature engineering.
Stay ahead by combining automated tools with domain expertise. Use rolling-window validation to keep up with market changes, and routinely evaluate feature performance using both technical metrics and real-world results.


