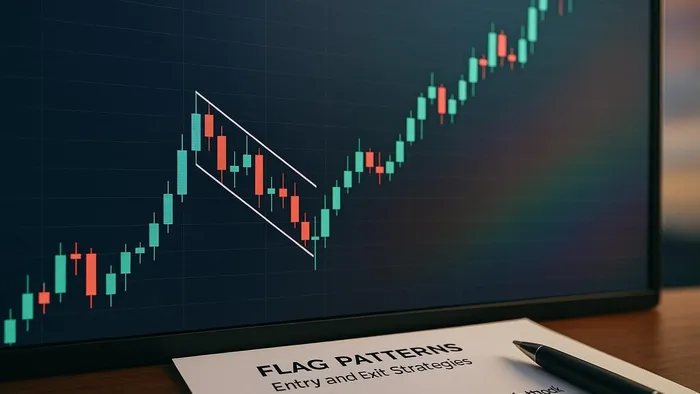

Learn to identify flag patterns, including entry and exit strategies, to enhance your trading effectiveness in trending markets.
Flag patterns are a popular tool for traders to identify opportunities in trending markets. Here's what you need to know:
- What Are They? A flag pattern consists of a sharp price move (flagpole) followed by a brief consolidation (flag) before resuming the trend.
- Why Use Them? They offer clear entry points, defined stop-loss levels, and profit targets, with a success rate of around 70 percent.
- Key Features
- Bullish Flags Downward-sloping consolidation after an upward move.
- Bearish Flags Upward-sloping consolidation after a downward move.
- Volume High during the flagpole phase, low during consolidation, and surges at breakout.
- Entry Strategies
- Breakout Entry Enter when price breaks the flag's boundary with volume confirmation.
- Pullback Entry Wait for a retest of the breakout level for a better risk-reward ratio.
- Exit Strategies
- Stop Loss Place stops just outside the flag's consolidation zone.
- Profit Target Measure the flagpole's height and project it from the breakout point.
- Risk Management Use a 1:2 risk-reward ratio and limit risk to 1 to 2 percent of your account.
LuxAlgo can automate flag-pattern detection, provide real-time alerts, and optimize strategies with AI Backtesting for better results. Flag patterns are ideal for traders seeking reliable setups in trending markets.
Basics of Identifying Flag Patterns, Crafting Exits and Stops (Trading Flag Patterns)
How to Identify Valid Flag Patterns
Understanding the basics of flag patterns is just the start. To truly master their use, you need to know how to spot valid formations and separate them from false signals. This requires a mix of structural analysis and technical tools.
Key Components of a Flag Pattern
At the heart of every flag pattern is the flagpole, the initial strong price movement that sets the stage. In bullish flags, the flagpole represents a sharp upward move, while in bearish flags, it reflects a steep decline. The strength and clarity of this momentum give the pattern its reliability.
Next comes the consolidation phase, where price moves counter to the flagpole’s direction. For bearish flags, you will see a series of higher lows; bullish flags show consecutive lower highs [2]. This phase creates the distinct look of the flag, which should slope opposite the flagpole.
Timing matters A valid flag pattern usually lasts from a few hours to several days [5]. If consolidation drags on too long, it may indicate a different pattern. The flag should stay rectangular or like a parallelogram, sloping away from the flagpole. This distinguishes it from wedges (converging trendlines) or pennants (small symmetrical triangles) [4].
Volume behavior also plays a big role. During the flagpole phase, trading activity should spike, showing strong momentum. As the flag forms, volume usually decreases, reflecting a pause before the next move.
Finally, understanding the differences between flags and similar patterns is key. Unlike wedges that narrow over time or pennants that form triangles, flag patterns maintain parallel boundaries [4].
Technical Tools to Confirm Trends
Once you have identified a potential flag pattern, technical tools can confirm its validity. Start by checking how the pattern aligns with long-term moving averages. In bullish flags, price should remain above key averages even during consolidation; in bearish flags, below.
Trendlines are also useful. Draw parallel lines along the highs and lows of the flag to outline its structure, help pinpoint potential breakout levels, and define risk.
Volume indicators such as On-Balance Volume (OBV) confirm pattern strength [1]. Look for volume expansion during the breakout phase to support trend continuation.
Multiple-timeframe analysis adds another layer: higher timeframes reveal the big-picture trend, while lower timeframes fine-tune entries and exits [4].
Fibonacci retracement levels often align with the flag's boundaries, offering insight into potential support and resistance zones. They can also highlight reversal areas.
Lastly, consider market context. Flag patterns work best in strong trends. Economic events and news that align with the pattern’s direction can boost breakout success [3].
Entry Strategies for Flag Patterns

Once you have validated a flag pattern, timing the entry is crucial. A well-timed entry can be the difference between locking in profits and missing out.
Breakout Entry Method
The breakout entry is straightforward: enter when price decisively breaks the flag boundary with confirmation.
For bullish flags, enter on a candle close above the upper trendline; for bearish, below the lower line [4]. Patience is key, wait for the close to confirm momentum [6].
Volume confirmation strengthens this strategy, though some traders opt to wait for a pullback to improve risk-reward.
Pullback Entry for Better Risk-Reward
Pullback entries offer precision by waiting for price to retest the breakout level, providing a better entry price and tighter stop.
After a bullish breakout, price often retests the upper boundary as support. Traders enter when price closes above that level [1]. Stops sit just below the retest level.
This approach lets traders place tight stops while retaining the full profit target, but requires patience: not every breakout offers a pullback [2].
Volume Confirmation for Better Accuracy

Volume analysis turns flag-pattern trading into a data-driven process. During consolidation, volume usually contracts [7]. A decisive spike on breakout confirms momentum.
| Volume Level | Entry Confidence |
|---|---|
| 1.5 to 2x Average | Moderate strength, proceed cautiously |
| 2 to 3x Average | Strong confidence, solid entry signal |
| 3x + Average | Very strong conviction, high-probability setup |
Bear flag patterns show a 60 percent to 70 percent success rate when supported by volume confirmation [7]. Bullish flags sit near 67.13 percent [1], underscoring volume’s importance. Watch volume build into the breakout, then spike on the move.
Exit Strategies and Risk Management
Even the best setup can fail, so having a clear exit plan is essential.
Stop-Loss Placement
For bullish flags, place a stop just below the lowest point in consolidation; for bearish, just above the highest [8].
"To manage risk effectively, place a stop loss just below the lowest point of the flag. If prices break lower, the pattern has failed and you will want to exit." – Alchemy Markets Team [6]
Aggressive traders use even tighter stops on the most recent swing. Trail stops upward as the trade moves in your favor.
Setting Profit Targets
To project targets, measure the flagpole’s height and project the same distance from the breakout. Or use Fibonacci retracement levels for more conservative targets [1].
Example: In Novocure Ltd (NASDAQ: NVCR), traders calculated a 3:1 target by multiplying their risk ($2) by three and adding it to a $23 entry for a $29 goal [9].
Risk-Management Techniques
Maintain a risk-reward ratio of at least 1:2 and risk only 1 to 2 percent per trade [10]. Confirm breakouts with volume and consider taking 25 to 50 percent off early.
Trailing stops lock in profits while giving trades room to grow. Even with roughly 70 percent success in flag patterns, risk management is the cornerstone of long-term success [1].
Trading Flag Patterns with LuxAlgo Toolkits
Identifying and validating chart structures manually is time-consuming. LuxAlgo streamlines the process through its exclusive toolkits, each designed to automate core price-action analysis and deliver actionable insights.
Automatic Detection of Key Price-Action Structures with Price Action Concepts (PAC)
The Price Action Concepts (PAC) toolkit highlights advanced price-action structures, volumetric order blocks, and market structure. By mapping critical zones, PAC allows traders to concentrate on context-driven decision-making rather than manual charting.
"For beginners and pros alike, PAC lets you focus on what matters—price action. Auto-pattern detection, volumetric order blocks, and advanced market structure are just the start, a superior way to find key levels." – LuxAlgo [12]
PAC can also highlight areas where institutional money may be active, helping traders pinpoint support and resistance levels for precise entries and exits.
Real-Time Alerts with Signals & Overlays
The Signals & Overlays (S&O) toolkit ensures you never miss key breakouts or pullbacks. Configure alerts for breakouts with high volume, specific timeframes or custom criteria. Overlay visualisations show signal strength, trend direction and momentum on-chart, saving time and effort.
Strategy Optimization with AI Backtesting
LuxAlgo’s AI Backtesting Assistant tests strategies across historical markets, delivering metrics such as success rate, average return and drawdown. Customise parameters (flagpole height, consolidation duration, volume thresholds) to find optimal conditions. Ultimate-plan users receive weekly scanners and backtests, surfacing fresh opportunities.
Key Takeaways
Summary of Main Strategies
Effective flag-pattern trading centres on identifying the flagpole, recognising the consolidation phase and spotting the breakout [10]. Research shows an approximate 70 percent success rate; bullish flags average 67.13 percent [1].
Choose between breakout or pullback entries, both confirmed by volume. Manage risk with stops outside consolidation and targets based on flagpole height or Fibonacci levels [10]. Multi-timeframe confirmation enhances accuracy [4]. LuxAlgo’s exclusive toolkits streamline each step.
How LuxAlgo Helps Traders
LuxAlgo removes much of the guesswork by offering exclusive toolkits and real-time alerts. Customisable alerts ensure you only receive signals that fit your plan. The AI Backtesting Assistant refines strategies for different market environments, and Ultimate users get weekly scans to stay up-to-date [13].
FAQs
How can I tell the difference between a flag pattern and wedges or pennants?
Flag patterns have two parallel trendlines forming a rectangle following a strong move. Pennants create a small triangle with converging lines, while wedges feature converging lines that slope up or down and often signal reversals.
How does volume confirm a flag-pattern breakout?
Volume usually spikes during the flagpole, contracts during consolidation and then surges on breakout. A clear volume spike confirms momentum and reduces false signals.
How can LuxAlgo’s AI Backtesting Assistant improve flag-pattern strategies?
The assistant tests strategies across market scenarios, pinpoints reliable signals, minimises false positives and suggests parameter tweaks—helping traders adapt quickly.
References
- LuxAlgo Official Site
- Signals & Overlays Alerts Documentation
- LuxAlgo AI Backtesting
- Breakout Detector Indicator
- PAC Fibonacci Documentation
- Dynamic Support & Resistance Indicator
- Volumetric Toolkit Indicator
- Breakouts with Tests & Retests Indicator
- Fibonacci Trailing-Stop Indicator
- Pure Price-Action Structures Indicator
- Market-Structures Documentation
- Candle-Body Support & Resistance Indicator
- Fetching Strategies Documentation
- AI Backtesting Assistant Breakdown
- LuxAlgo Toolkits Feature Overview
- TrendSpider – Flag Patterns
- BitMEX – Continuation Patterns
- XS.com – Flag Patterns
- FBS – Flag Patterns in Trading
- Strike.money – Flag Pattern Analysis
- Alchemy Markets – Bull Flag Strategy
- NetPicks – Bear Flag Chart Pattern
- ProTradingSchool – Flag Pattern Trading
- ChartMill – High-Tight Flag
- TraderVue – Flag Patterns
- ArtsylTech – Bull vs. Bear Flags
- FundYourFX – Flag Patterns
- Novocure Ltd.
- NASDAQ
- Flag Patterns Video Tutorial


