
Learn how to identify and trade the Island Reversal candlestick pattern for potential market trend reversals with key strategies and tips.
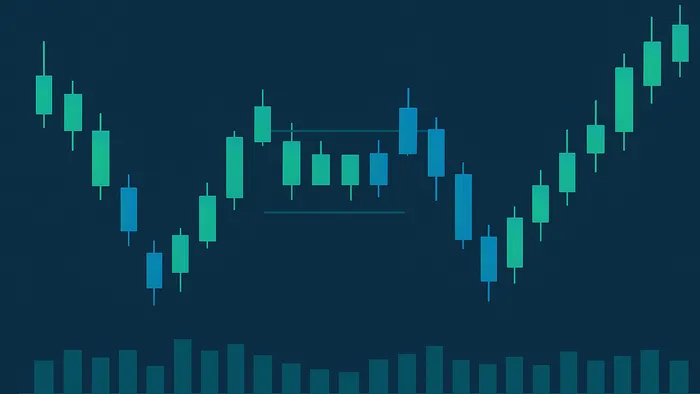
The Island Reversal is a Island Reversal indicator in the LuxAlgo Library that signals a potential reversal signals in the Oscillator Matrix toolkit on TradingView. It forms when a price gap appears, followed by a period of isolated consolidation, and ends with a gap in the opposite direction. This “island” setup is often used by traders to spot significant market shifts.
Key Features of Island Reversals:
- Initial Trend: A strong trend (up or down) precedes the pattern.
- First Gap: A price gap starts the formation.
- Island Phase: A period of sideways price movement lasting 1–2 weeks.
- Second Gap: A gap in the opposite direction confirms the reversal.
- Volume Spike: Increased trading volume during the second gap strengthens the signal.
Types of Island Reversals:
| Feature | Bullish Reversal | Bearish Reversal |
|---|---|---|
| Market Context | Follows a downtrend | Occurs after an uptrend |
| Initial Gap | Downward gap | Upward gap |
| Final Gap | Upward gap | Downward gap |
| Signal | Indicates price increase | Suggests price drop |
How to Trade It:
- Entry: Wait for the second gap with confirmed volume.
- Stop Loss: Place it just beyond the island range.
- Profit Targets: Use the dynamic support & resistance indicator in the Price Action Concepts toolkit on TradingView or Fibonacci retracements.
Avoid These Mistakes:
- Trading in low-volume markets.
- Ignoring confirmation signals like volume or technical indicators.
- Misinterpreting false signals due to unclear gaps.
The Island Reversal is a reliable pattern for spotting market reversals when combined with proper analysis and risk management.
Tips for How to Trade the Island Reversal Candlestick Pattern
Finding Island Reversals
This section explains how to identify Island Reversal patterns on your charts effectively.
Recognizing the Pattern
Start by analyzing daily charts to spot a clear trend and noticeable price gaps. Look for a significant gap (usually 2–5% or more) that separates recent price movements. This gap is followed by a 1–2 week period of sideways consolidation with increased trading volume. Finally, a second gap in the opposite direction confirms the reversal. The second gap typically shows the highest trading volume, indicating strong market conviction in the reversal.
Key Chart Components
To confirm a valid Island Reversal pattern, ensure these elements are present:
- Initial Trend: Downtrend for bullish reversals; uptrend for bearish reversals.
- First Gap: Downward for bullish reversals; upward for bearish reversals.
- Island Formation: A sideways consolidation phase lasting 1–2 weeks.
- Second Gap: Upward for bullish reversals; downward for bearish reversals.
- Volume Spike: The second gap should have the highest trading volume.
Choosing the Right Time Frame
Daily charts are ideal for identifying Island Reversals, offering clear pattern visibility and trading opportunities. Review at least 2–3 months of prior price data to understand broader context and evaluate volume trends accurately.
Trading with Island Reversals
Entry and Exit Rules
Wait for the final gap to form with confirmed volume before entering. Typically, enter on the first pullback after the breakout surge. For bullish reversals, use key support levels to set your exit; for bearish reversals, rely on resistance levels.
Stop Loss Placement
Place your stop loss just beyond the island formation to avoid invalidation while allowing for normal price fluctuations:
| Pattern Type | Stop Loss Placement | Additional Notes |
|---|---|---|
| Bullish Reversal | Below the low of the island | Add a small buffer for volatility |
| Bearish Reversal | Above the high of the island | Consider round numbers near key levels |
To protect your gains, use the trailing stop indicator in the Price Action Concepts toolkit on TradingView as the trend develops. If the market is highly volatile, consider wider stops to avoid being stopped out too early.
Profit Target Methods
Once your stop loss is in place, set clear profit targets to maximize gains. For bearish reversals, aim for the top of the previous trading range before the gap. Structure your targets as follows:
- Primary Target: Previous support or resistance levels.
- Secondary Target: Fibonacci retracement levels, such as 50%, 61.8%, or 70%.
- Extended Target: The measured size of the island formation from your entry point.
For example, in early 2023, GBP/USD traders achieved over 300 pips by spotting an Island Reversal and applying these strategies effectively. To maintain consistent profitability, aim for a minimum risk-reward ratio of 2:1. If the breakout shows signs of weakening, adjust your profit targets—but always stick to your stop-loss plan.
Pattern Verification Methods
Once you've established your rules, confirm the Island Reversal pattern using additional methods to strengthen reliability.
Volume Analysis
Volume is key to confirming an Island Reversal. Studies indicate that higher trading volumes during formation enhance reliability. Pay attention to volume levels between the gaps—a noticeable increase during the second gap strongly supports the reversal.
Technical Indicators
Incorporate multiple indicators to back up reversal signals in the Oscillator Matrix toolkit. Combining momentum-based and trend-based tools is common:
| Indicator Type | Specific Tools | Confirmation Signals |
|---|---|---|
| Momentum | RSI, MACD | Momentum aligns with the reversal direction |
| Trend | Moving Averages | Crossovers support the reversal trend |
When these indicators align across multiple timeframes, the chances of a successful trade improve.
Time Frame Confirmation
Island Reversal patterns can develop over days or even months. To confirm:
- Analyze your primary trading timeframe.
- Cross-check the overall trend on a higher timeframe.
- Refine entry points using a lower timeframe.
If the pattern holds consistently across timeframes and the gaps remain visible, it adds weight to the reversal signal. Larger gaps with rising volume often point to stronger reversal potential.
Mistakes to Avoid
When working with Island Reversals, avoid common errors that can undermine your strategy.
Spotting Fake Signals
Not every pattern is reliable. False signals often occur when patterns aren’t properly confirmed. Use this guide to differentiate:
| Signal Type | Key Characteristics | How to Confirm |
|---|---|---|
| Genuine Signal | Clear gaps on both sides, high volume, aligned indicators | Verify across multiple timeframes |
| False Signal | Unclear gaps, low volume, conflicting indicators | Use additional technical analysis |
| Breakout Trap | Brief gap reversal back into the island range | Confirm with volume and trend data |
Risk Control Methods
- Position Sizing: Base your position size on the distance between entry and stop-loss to maintain consistent risk levels.
- Stop-Loss Placement: Adjust for volatility so it’s neither too tight nor too loose.
When Not to Trade
- During extremely low-volume periods.
- When major economic news is imminent.
- In choppy or directionless markets.
- If gaps are influenced by pre- or post-market trading activity.
Summary
Here’s a quick recap of the key takeaways from the analysis above.
Main Points Review
The Island Reversal pattern serves as a reliable indicator of market reversals when identified accurately.
| Component | Key Features | Trading Implications |
|---|---|---|
| Pattern Structure | Clear gaps with an isolated range | Defines reversal boundaries |
| Volume Profile | Higher trading activity | Confirms the pattern’s strength |
| Time Duration | Lasts from one to several days | Impacts the pattern’s reliability |
| Trend Context | Requires an established trend | More common in bearish scenarios |
Practice Guidelines
-
Develop Recognition Skills
- Use daily timeframe charts to spot patterns effectively.
- Pay attention to trend, gaps, consolidation, volume, and isolation.
-
Trade Execution
- Start with paper trading to refine recognition skills.
- Confirm signals using volume and technical indicators before entering a trade.
References
- Island Reversal indicator in the LuxAlgo Library
- Oscillator Matrix Reversal Signals documentation
- Dynamic Support & Resistance indicator (Price Action Concepts toolkit)
- Fibonacci tools in the Price Action Concepts toolkit
- Fibonacci retracement (Wikipedia)
- Island Reversal pattern overview (Investopedia)


