Market Structure Shifts (MSS) in ICT Trading
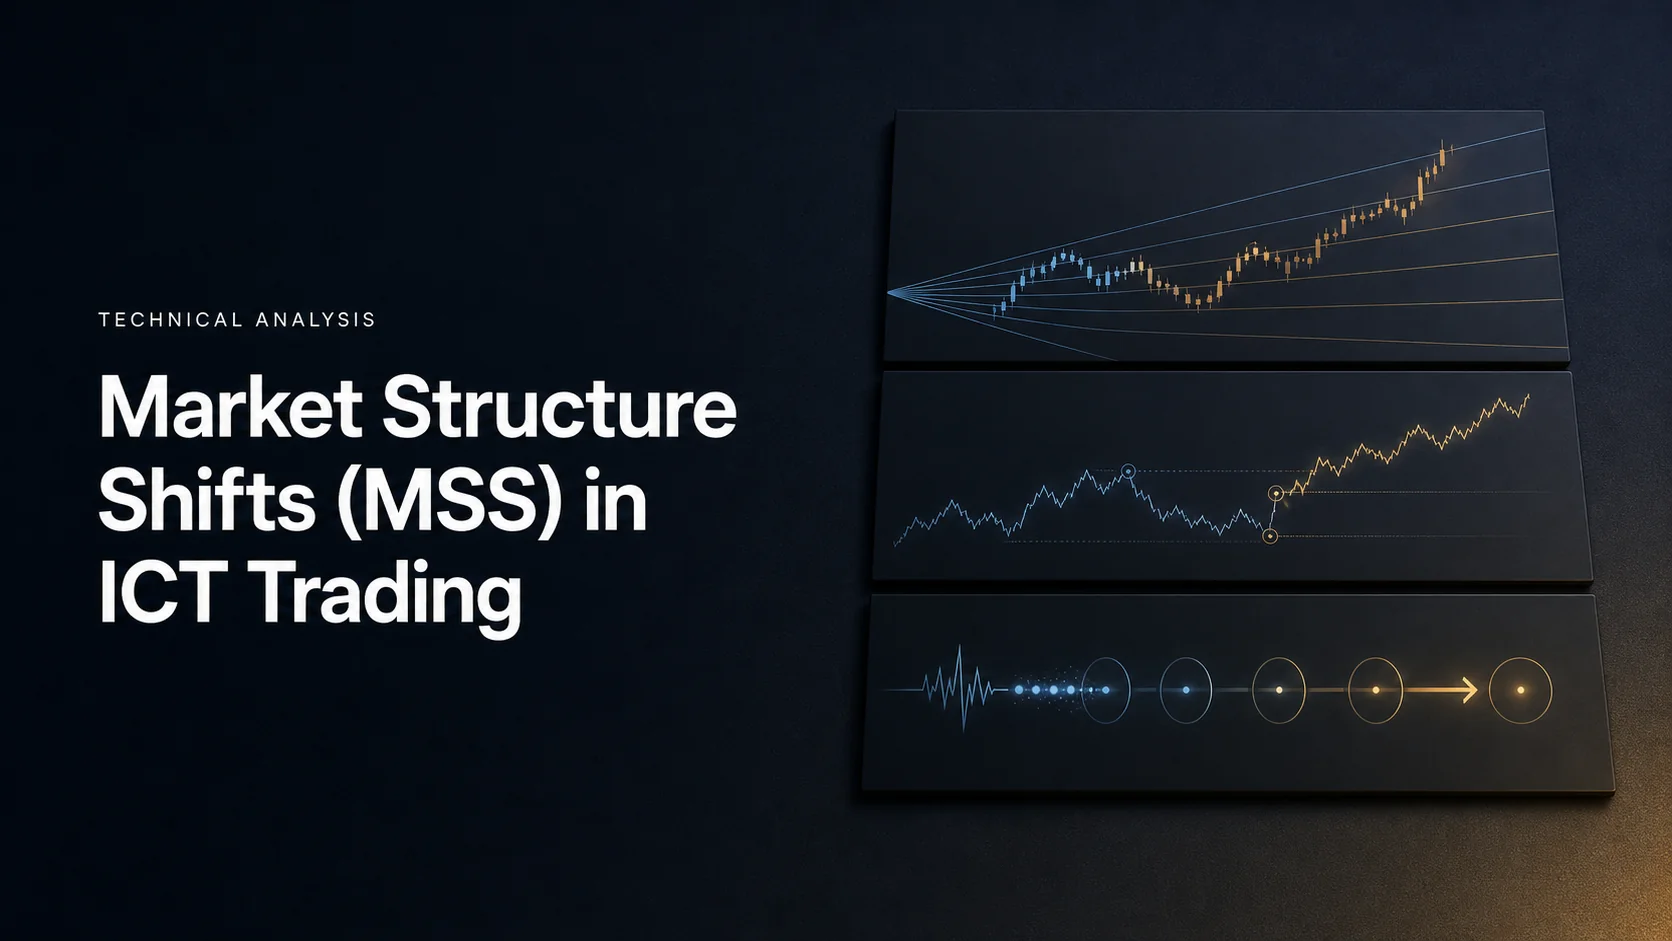
A Market Structure Shift (MSS) is a defined break against the recent swing sequence, commonly evaluated with displacement in ICT-style analysis. A bullish hypothesis may begin when price breaks a relevant lower high during a downtrend; a bearish hypothesis may begin when price breaks a relevant higher low during an uptrend. The break identifies a possible change in behavior, not a guaranteed new trend.
The essential task is to define the swing, the required break and when the signal becomes knowable. MSS and Change of Character (CHoCH) terminology overlaps across educators and indicators. There is no universal rule that MSS is always short-term while CHoCH is always a major long-term reversal.
Use LuxAlgo’s charting and AI platform to make the analysis repeatable. Inspect swings and native indicators on Quant Charts, then ask Quant, our coding agent, to help implement specific structure, entry, exit and risk rules. A candle pattern or indicator label does not identify the participants behind the move.
MSS vs BOS vs CHoCH: Key Differences
What Is Market Structure Shift?
In an illustrative bullish model, price first forms lower highs and lower lows. A later completed close above the selected lower high, with a predefined displacement requirement, makes a bullish MSS eligible. The bearish model reverses that sequence. A break of any minor swing is not automatically a meaningful shift.
Some ICT methods add a prior liquidity sweep, a particular protected swing or a Fair Value Gap. Other implementations use a simpler opposing structure break. State the chosen convention before comparing examples. Do not quietly change it to exclude losing setups.
Compare Definitions Rather Than Fixed Timeframes
| Term | Common interpretation | What must be specified | What it does not prove |
|---|---|---|---|
| MSS | A structure break against the recent sequence, often with displacement | Relevant swing, break criterion and any sweep/displacement filter | That a lasting reversal or institutional shift has occurred |
| CHoCH | An initial change against the detected structural direction; sometimes called MSS | The indicator or educator’s definition and swing scale | That the event belongs only to a long-term timeframe |
| BOS | A break in the direction of the detected trend | Prior structural state and qualifying high/low | That continuation will persist after the break |
For example, a break above a prior high in an established uptrend is commonly labeled a bullish BOS. A break below a relevant higher low can support a bearish change-of-character hypothesis. The labels describe events under the method; they are not separate promises about the next price move.
Some structure tools note that CHoCH is sometimes called a market structure shift, distinguish a leading CHoCH from a supported CHoCH+ using the preceding swing sequence, and classify BOS after a CHoCH under their own logic. These are tool definitions, not a universal taxonomy for every ICT strategy.
Avoiding Missteps
Separate a valid signal from a profitable result. A fully confirmed MSS can fail. If “true MSS” is defined only after sustained future follow-through, a historical review can accidentally exclude losses using information unavailable at entry.
Likewise, a wick through a level and a candle close beyond it are different conditions. Choose one, specify any buffer, and test the delay or false signals it creates. Several indicators based on the same prices do not necessarily provide independent confirmation.
How to Identify and Trade MSS Patterns
Spotting Bullish and Bearish MSS
- Define the recent structure: use consistent swing rules to identify higher highs/higher lows or lower highs/lower lows.
- Choose the relevant opposing level: identify which swing must break before the directional hypothesis changes.
- Define displacement: use a measurable condition, such as candle range relative to recent volatility and a close beyond the level, instead of deciding visually afterward.
- Wait for the required information: include swing-confirmation bars and the completed break candle.
- Apply an entry model: enter after confirmation or wait for a defined pullback; do not assume both methods have the same fills or results.
A large candle can support a displacement definition, but size alone is not enough. Its location, direction, closing position and relationship to the relevant swing matter. A gap or news spike can cross the level without offering a fill near it.
RSI can describe momentum and OBV can summarize signed volume accumulation. Neither confirms who traded or guarantees follow-through. The StockCharts RSI guide explains why overbought/oversold readings and divergence need trend context: extremes can persist rather than immediately reverse.
Using Multiple Timeframes for MSS Context
A broader chart can define context while a lower chart supplies an entry trigger. For example, a completed daily bullish shift may lead to an hourly or 15-minute pullback model. The lower chart can also shift in the opposite direction temporarily, so specify which timeframe controls the decision.
| Illustrative style | Context timeframe | Intermediate view | Entry timeframe |
|---|---|---|---|
| Swing trading | Daily | 4-hour | 1-hour |
| Day trading | 1-hour | 15-minute | 5-minute |
| Scalping | 15-minute | 5-minute | 1-minute |
These are examples, not required combinations or a consistent 4:1/6:1 spacing rule. A 15-minute to five-minute step is 3:1; five-minute to one-minute is 5:1. More chart panels do not automatically improve precision.
Use only the higher-timeframe data available at the lower-timeframe decision. A developing daily candle cannot be treated as its final close during an intraday backtest. Thirty trades may expose workflow mistakes, but they do not establish statistical reliability across regimes.
Combining MSS with Order Blocks, FVGs and Liquidity References
An order block can identify a proposed pullback zone preceding the displacement. A Fair Value Gap can define a different retracement area. Neither is a direct record of outstanding institutional orders. Test whether an MSS model improves when it waits for either zone rather than assuming confluence is always beneficial.
A bullish three-candle FVG has the third candle’s low above the first candle’s high; a bearish FVG has the third candle’s high below the first candle’s low. The middle candle can trade through the interval, so the pattern does not imply no trading occurred there. A closed-bar FVG rule cannot confirm until the third candle closes.
Prior highs, lows and equal-level clusters can serve as liquidity references. They do not reveal the exact quantity or ownership of stop orders. A sweep followed by displacement is an observable sequence; attributing it to deliberate institutional stop hunting requires evidence beyond the candle chart.
Define whether the entry waits at an FVG, an OB or the broken swing, how long the order remains eligible, and what cancels it. A retracement can never arrive or can pass straight through the zone. Set targets and stops before observing that outcome.
LuxAlgo Tools for MSS Analysis
Native Market Structure Oscillator on Quant Charts
The Market Structure Oscillator blends short-, intermediate- and long-term structural components into one reading. Short-term price swings seed the longer-term structures, and adjustable weights control their influence. These are calculation horizons, not necessarily three different chart timeframes.
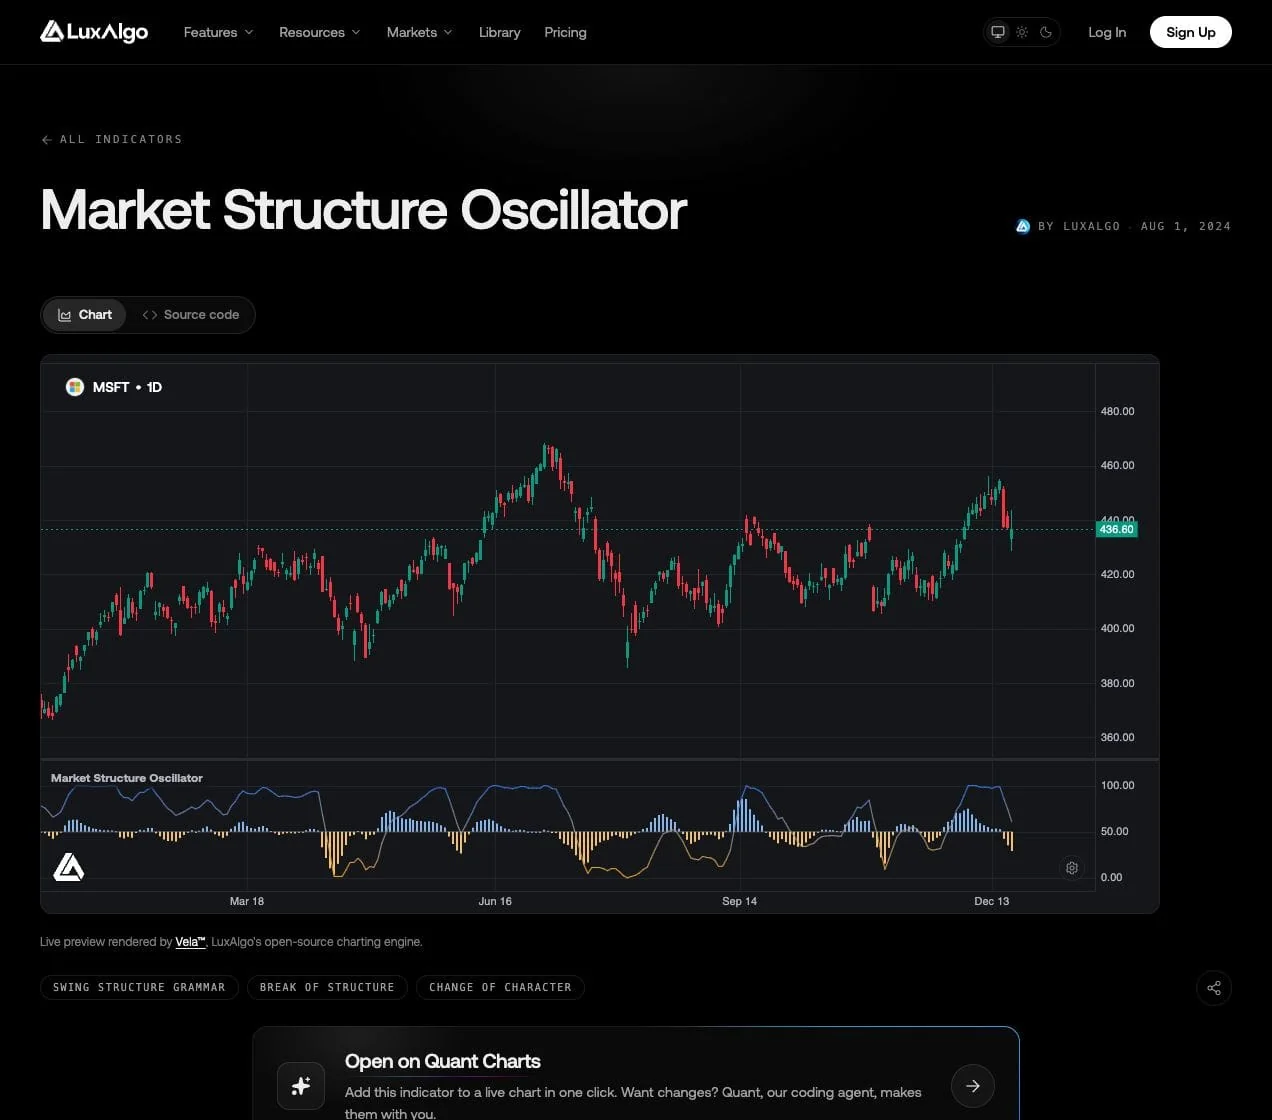
The documented settings include term weights, smoothing, Equilibrium Cross Signals, the cycle histogram and cycle signal controls. Display options can show structures on price and separate per-term oscillator plots. Choose the components relevant to the hypothesis instead of treating every cross or extreme as a reversal instruction.
An oscillator cross and a price break are different events. If the strategy requires both, specify their order and permitted separation. Review when each signal becomes knowable and whether smoothing or swing confirmation delays the entry.
Market Structure Tools in the Library
The Library’s market-structure tools label internal and swing structure on a Quant Chart. Their lookback settings control swing scale; they do not assign universal MSS versus CHoCH timeframes.
Some tools label leading changes as CHoCH and supported changes as CHoCH+. A supported change has a preceding early structural warning, such as a failed higher high in an uptrend or failed lower low in a downtrend. This distinction describes the sequence, not a calibrated confidence score.
Displayed swing-high/low points are retrospective. They are not detected at the earlier location where they are plotted and should not be used as real-time signals at that origin. Use the actual detection event and check the relevant structure labels separately.
Setting Up Alerts Around Defined Events
Quant can turn a structure rule into a strategy whose strategy alerts fire on the event that matches the model, such as an internal or swing break or an equal highs/lows test.
For any alert, record the symbol, timeframe, settings, evaluation frequency and confirmation policy. Define duplicate suppression or a cooldown where supported, and specify whether the alert permits a new entry or only requests a chart review. An alert is not a guaranteed fill or protection against slippage.
Keep the workflow focused on a few useful components. A structure label, oscillator condition and risk rule may be sufficient for a test. Adding target tools, chat notifications and scanners without checking their actual supported inputs can obscure the decision rather than automate it reliably.
Testing and Improving MSS Strategies
Build the Complete Rule with Quant
Write the swing definition, displacement threshold, break rule, entry order, stop, target, time exit and size cap before testing. Ask Quant to help implement them, inspect Code and click Run yourself. Follow Making Strategies with Quant and the native backtest guide to review the resulting trades.
Inspect individual signals to ensure pivots and higher-timeframe closes are not backdated. Check whether the strategy can access the selected indicator’s logic in its runtime; a visible marker is not automatically a callable input.
Compare the base MSS model with versions adding a sweep, FVG, oscillator or trend filter. Use the same data, cost assumptions and risk budget. If filtering removes trades, report the resulting sample size and total opportunity as well as the change in win rate.
Measure More Than Win Rate
Review expectancy, average win/loss, maximum drawdown, exposure, trade count and performance by period. A Sharpe ratio above 0.75 is not a universal passing grade; interpretation depends on sampling, annualization, costs and the strategy’s return distribution.
At 40% wins averaging 2R and 60% losses averaging 1R, expectancy is 0.40 × 2R − 0.60 × 1R = +0.20R before costs. At 0.10R cost per trade it becomes +0.10R. At 30% wins with the same gross payoffs, expectancy is −0.10R before costs. A 2R target alone does not establish an edge.
Use Chronological Validation
Separate training, validation and untouched evaluation periods, or use a predefined walk-forward schedule. Select parameters using only the training window and include the execution cost of changes. Repeatedly optimizing on the same data can fit noise.
Test nearby settings and difficult periods, including ranges, persistent trends and sharp transitions. Record missed entries, failed shifts and large adverse moves. Historical backtesting evaluates past data; demo forward testing records decisions as new data arrive. They are complementary checks.
Managing MSS Risks and False Signals
False Breaks and News Events
A structural break may quickly reverse, even after it meets the chosen confirmation rule. A larger displacement filter or a later close can reduce some early entries while increasing delay. Evaluate that trade-off instead of promising to eliminate false signals.
Scheduled interest-rate decisions, employment reports and inflation releases can change volatility and liquidity. A 15–30-minute exclusion window before or after a release is a research choice, not a universally adequate buffer. Check the official release schedule, timezone and the instrument’s session, then test the chosen policy.
Volume spikes and OBV can add context, but aggregate or tick volume does not prove institutional participation. Cumulative delta and order-flow analysis depend on the trade data and classification used. Ensure the feed supports the claim before comparing activity across instruments.
Risk Controls and a Worked Bullish MSS Trade
Choose an invalidation level first. A bullish model might use a stop below the relevant swing low, while a bearish model might use a stop above the relevant high. Add any buffer explicitly. The distance to the actual entry determines quantity; the level alone does not guarantee a maximum loss.
Suppose a stock has been making lower highs and lower lows. The selected lower high is $100, and the relevant low is $96. A qualifying candle closes above $100, but the first permitted entry fills at $101. With a stop at $95.50, a target at $112 and a $25,000 account using an illustrative 0.5% budget, the trade is calculated as follows.
| Item | Calculation | Meaning |
|---|---|---|
| Risk budget | $25,000 × 0.5% = $125 | Chosen planned price-risk allowance |
| Entry-to-stop distance | $101 − $95.50 = $5.50 per share | Do not calculate from the broken $100 level instead of the fill |
| Whole-share quantity | Floor($125 ÷ $5.50) = 22 shares | $121 planned loss and $2,222 notional exposure |
| Target reward | 22 × ($112 − $101) = $242 | 2R gross reward relative to $121 planned risk |
| Stop fills at $94 | 22 × ($101 − $94) = $154 loss | About 1.27R before fees despite the original stop |
| Later entry at $103 | ($112 − $103) ÷ ($103 − $95.50) = 1.2R | A worse entry changes the reward-to-risk; recalculate size |
The example illustrates sizing, not a verified profitable strategy. A commonly cited 1–2% risk budget is not universally conservative, and it refers to planned loss rather than position value. Futures, forex and other contracts require their point value, contract size and currency conversion.
Investor.gov explains that a triggered stop becomes a market order, so the execution price is not guaranteed. Limit orders can remain unfilled. Include spread, fees, gaps and slippage, and cap aggregate exposure across correlated positions.
Systematic Execution and Review
Wait for the agreed confirmation and follow the planned exit. Do not widen the stop or switch to another swing definition after entry merely to keep the trade alive. Keep adequate margin and an exposure limit; a tight stop does not make a highly leveraged position harmless.
Log the original chart, signal time, rule version, actual fills and reason for exit. Separate implementation or execution errors from setups that followed the rules and lost. Revise through a documented test cycle rather than reacting to each outcome.
Spotting Market Structure Shifts: Video Explainer
The existing video offers a visual explanation of MSS. Apply its terminology consistently and distinguish what could be known at the signal time from the follow-through visible later on a completed chart.
Key Points and Next Steps
Start with one clearly defined swing-and-break model. Add displacement and any contextual filters only when their roles are explicit. Use Quant Charts for visual inspection and Quant to help test timing, orders and risk.
Practice on historical examples and in forward simulation, including failures and periods without a trade. MSS can organize a reversal hypothesis, but it does not reveal institutional intent or guarantee early entry, shorter drawdowns or sustained follow-through.
FAQs
Is MSS always short-term while CHoCH is long-term?
No. Terminology overlaps across methods, and some tools note that CHoCH is sometimes called MSS. Define the swing scale and confirmation rule rather than assigning each label a universal timeframe.
How can I distinguish an MSS signal from a false breakout?
Use a predefined swing, break and displacement rule, then record every qualifying signal. A confirmed signal can still fail. Future follow-through cannot be used as information available at the original entry.
How do order blocks and liquidity references help MSS analysis?
They can define context, retracement entries or targets. They do not prove institutional orders or guarantee a reaction. Compare the base MSS model with and without each additional condition.
Can an earlier plotted swing be used as an immediate entry signal?
Not if later bars were needed to confirm it. The plotted origin and the first time the swing became knowable are different. Respect that delay and the timing of higher-timeframe data in historical tests.
How can LuxAlgo help analyze and test MSS?
Inspect native structure tools on Quant Charts, ask Quant to help implement explicit rules, inspect Code and click Run. Review individual trades and out-of-sample results, and keep each tool’s detection settings in view.
Does a 2:1 reward-to-risk target make an MSS strategy profitable?
No. Profitability depends on realized win rate, average wins and losses, costs and execution. For example, 30% wins at 2R and 70% losses at 1R produce −0.10R expectancy before costs.
References
LuxAlgo Resources
- Quant Charts
- LuxAlgo Quant
- Market Structure Oscillator
- Library Market Structure Tools
- Making Strategies with Quant
- Native Backtest Guide
- Backtesting with Quant
External Resources
Read next