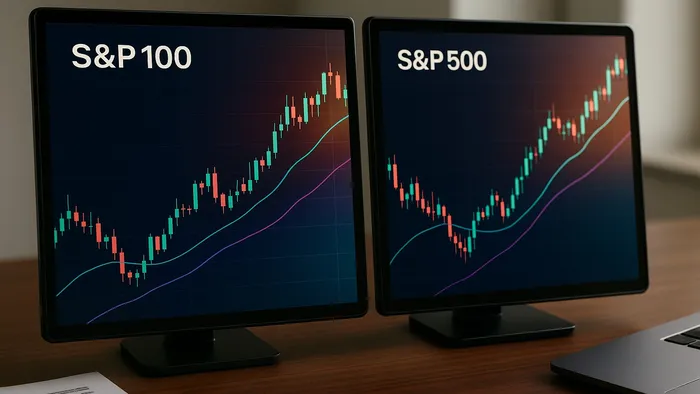
Explore the key differences between the S&P 100 and S&P 500 indices to determine which benchmark aligns with your investment strategy.
Which index should you choose: the S&P 100 or the S&P 500?
The S&P 100 focuses on the largest, most stable U.S. companies, offering lower volatility and a concentrated portfolio. Meanwhile, the S&P 500 covers a broader range of 500 companies, representing 83% of the U.S. equity market, making it ideal for diversification and tracking overall market trends.
Key Differences at a Glance:
- S&P 100: Mega-cap focus, lower volatility, ideal for options trading and defensive strategies.
- S&P 500: Broad market exposure, moderate volatility, great for diversification and long-term growth.
| Characteristic | S&P 100 | S&P 500 |
|---|---|---|
| Market Coverage | 61% of U.S. equity market | 83% of U.S. equity market |
| Average Company Size | ~$135 billion | ~$40 billion |
| Volatility | Lower | Moderate |
| Portfolio Focus | Mega-cap companies | Broad, large-cap companies |
Your choice depends on your goals: stability and focus (S&P 100) or diversification and market-wide performance (S&P 500). Dive deeper to learn how these benchmarks can shape your strategy.
Which Has Performed the Best: S&P 500 vs S&P 100 vs S&P …
Index Structure and Methods
Let’s dive into how the S&P 100 and S&P 500 differ in their structure. While both indices rely on a float-adjusted market-cap weighting (giving larger companies more sway) they take distinct approaches in representing the market.
S&P 100: A Focus on Market Leaders
The S&P 100 is made up of some of the largest and most established companies within the S&P 500. These companies are recognized for their strong market presence and financial stability. As of December 2024, the S&P 100 highlights key leaders in the U.S. market.
This index stands out for its concentrated structure. With an average free-float market capitalization of about $135 billion, the companies included are significantly larger than those in broader indices. This size often results in lower volatility, making it a more stable option for investors compared to more diverse indices.
On the other hand, the S&P 500 takes a much broader approach.
S&P 500: Broad Market Representation
The S&P 500 captures a wide slice of the market. Companies are selected based on market cap, financial health, liquidity, public float, and sector balance. A committee oversees the selection process and can make adjustments at any time. This ensures the index remains reflective of roughly 83% of the total U.S. market capitalization.
Comparing the Two Indices
Here’s a quick breakdown of how the two indices stack up:
| Characteristic | S&P 100 | S&P 500 |
|---|---|---|
| Market Coverage | 61% of U.S. market | 83% of U.S. market |
| Average Company Size | ~$135 billion | ~$40 billion |
| Selection Process | Subset of largest S&P 500 companies | Committee-based selection |
| Volatility Profile | Lower volatility | Moderate volatility |
| S&P 500 Coverage | 71% | 100% |
These structural differences mean the indices serve different purposes. The S&P 100 focuses on leading companies, offering a more concentrated investment option. Meanwhile, the S&P 500 provides a broader view of the market, covering a wider range of sectors and company sizes.
Trading and Investment Applications
The S&P 100 and S&P 500 cater to different trading and investment strategies, each offering unique advantages depending on your market approach.
S&P 100: Focus on Major Companies
The S&P 100 highlights mega-cap companies, providing the stability often associated with blue-chip stocks. This makes it particularly useful for:
| Strategy Type | Application | Key Advantage |
|---|---|---|
| Options Trading | Large-cap derivatives | Better liquidity and tighter spreads |
| Blue-Chip Investing | Stock selection | Lower risk from individual companies |
| Defensive Positioning | Protection in downturns | More stable performance during market declines |
On the other hand, the S&P 500 is designed for broader market coverage.
S&P 500: Comprehensive Market Exposure
"The S&P 500 is largely considered an essential benchmark index for the U.S. stock market".
Its wide coverage supports various strategies, including:
- Benchmarking portfolio performance: Compare your returns against the broader market.
- Sector rotation: Shift investments between sectors based on market conditions.
- Long-term planning: Build portfolios designed for growth over decades.
The index is updated quarterly, ensuring it reflects the current large-cap market landscape.
Choosing the Right Index
The unique characteristics of these indices help investors decide which one aligns with their goals.
S&P 100 is ideal for:
- Focusing on market-leading companies
- Reducing portfolio volatility
- Engaging in options trading
- Taking defensive positions during uncertain times
S&P 500 works best for:
- Achieving broad market exposure
- Diversifying portfolios across industries
- Monitoring overall market health
- Planning for long-term growth
As of July 2023, the S&P 500 delivered a 10-year return of 172.2%, driven by its concentrated structure where top holdings heavily influence performance. This concentration is an important factor when balancing portfolios that include assets beyond U.S. large-cap stocks.
Returns and Risk Analysis
The S&P 100 and S&P 500 have distinct risk-return profiles that can shape investment outcomes. These metrics highlight how differences in concentration and diversification influence performance.
Return Statistics
Recent data highlights the S&P 100's focus on mega-cap stocks, which leads to unique return patterns, particularly during market fluctuations. Its concentrated structure drives performance outcomes that differ from the broader S&P 500.
| Performance Metric | S&P 100 | S&P 500 |
|---|---|---|
| Daily Volatility (2025) | 1.36% | 2.20% |
| Market Coverage | 61% of U.S. market | 83% of U.S. market |
| Market Cap Focus | Mega-cap ($135B avg.) | Large-cap ($40B avg.) |
| Sector Distribution | Concentrated | Broad-based |
| Risk Profile | Lower volatility | Moderate volatility |
Risk Measurements
The risk profiles of these indices highlight their core differences. The S&P 100's emphasis on mega-cap companies results in lower volatility, reflecting the stability of larger, established firms. In contrast, the S&P 500's broader diversification introduces moderate volatility, offering a balance between risk and return.
These differences underline how each index caters to distinct investment strategies. The S&P 100 provides stability through its focus on mega-cap stocks, making it suitable for investors seeking lower volatility. On the other hand, the S&P 500 offers broader market exposure, appealing to those who prioritize diversification and are comfortable with moderate risk levels.
Using LuxAlgo for Index Trading
LuxAlgo provides exclusive toolkits and an AI backtesting platform tailored to the distinct dynamics of the S&P 100 and S&P 500, allowing traders to analyze and trade these indices more effectively.
LuxAlgo Tools for Stock Analysis
LuxAlgo offers a range of toolkits designed to support various aspects of index trading:
| Toolkit | S&P 100 Use | S&P 500 Use |
|---|---|---|
| Price Action Concepts | Identifies patterns in mega-cap stocks | Analyzes overall market structure |
| Signals & Overlays | Delivers real-time trading signals | Supports multi-timeframe analysis |
| Oscillator Matrix | Detects divergences | Tracks money flow trends |
Testing Strategies with AI

The AI Backtesting Assistant is a web-based platform that helps traders refine their strategies. With this platform, you can:
- Test strategies on different timeframes
- Adjust parameters to align with specific index behaviors
- Review performance metrics for both indices
"Lux Algo has really stepped my trading up, there is a setup for any style of trading you prefer which is very nice you don't have to put yourself in a box metaphorically speaking." – Kevin Ortega
These AI-powered insights make it easier to customize tools for practical trading needs.
Setting Up LuxAlgo Tools
To access the full range of LuxAlgo features, consider the Ultimate Plan ($59.99 / month). This plan includes a powerful optimization engine, weekly scanners, and priority strategy support.
The platform’s automated alerts and screeners pinpoint high-probability entry and exit points. This is particularly useful for tracking the concentrated movements of the S&P 100's mega-cap stocks or the broader trends within the S&P 500.
"Hands down BEST indicators you can find... The cool thing is.. they make videos and walkthroughs of LITERALLY every indicator and setting and what it does." – Eric Bland
LuxAlgo integrates seamlessly with TradingView, providing real-time analysis. Combined with the AI Backtesting Assistant, traders can fine-tune their strategies using historical data from both indices.
Conclusion
The S&P 500 offers broad market exposure with an annualized return of 11.88% from 1957 to 2021. On the other hand, the S&P 100 focuses on the largest U.S. companies, giving traders a more concentrated view of major corporate performance. These differences can help shape your trading approach.
Each index serves a specific purpose. The S&P 500 is a reliable gauge of overall market health, thanks to its wide representation. Meanwhile, the S&P 100 zeroes in on blue-chip stocks, making it a useful tool for tracking trends among the largest corporations. Notably, the top 10 holdings account for 30.6% of the S&P 500, underscoring the impact of these key players.
FAQs
What’s the difference between the S&P 100 and S&P 500, and how does their selection process affect market representation?
The S&P 500 includes 500 of the largest publicly traded companies in the U.S., covering a wide range of industries and accounting for about 80% of the total U.S. stock market capitalization. In contrast, the S&P 100 is a subset of the S&P 500, featuring 101 of the largest and most established companies, representing roughly 67% of the S&P 500’s market value.
The selection process for the S&P 500 focuses on capturing a broad market representation by including companies across various sectors, while the S&P 100 emphasizes the largest and most liquid stocks, making it more concentrated. This difference means the S&P 500 is better for analyzing overall market trends, while the S&P 100 is often used for strategies requiring a focus on blue-chip stocks or lower volatility.
What are the advantages of using the S&P 100 for options trading compared to the S&P 500?
The S&P 100 offers several unique advantages for options trading compared to the broader S&P 500. Since the S&P 100 focuses on the largest and most liquid companies within the S&P 500, its components often have higher trading volumes and tighter bid-ask spreads. This can make options trading more efficient and cost-effective.
Additionally, the S&P 100's smaller size and focus on mega-cap companies provide a more concentrated exposure to market leaders, which can be beneficial for traders looking to target well-established, high-capitalization stocks. This focus can also make it easier to analyze and predict market movements compared to the more diversified S&P 500. However, the choice between the two benchmarks ultimately depends on your trading goals, risk tolerance, and strategy.
When should an investor choose the S&P 500 instead of the S&P 100 for long-term growth strategies?
An investor may prefer the S&P 500 for long-term growth strategies due to its greater diversification and representation of the broader U.S. economy. With 500 large-cap companies spanning multiple industries, the index provides exposure to a wider range of market sectors compared to the S&P 100, which focuses on the largest 100 companies.
This broader scope can help reduce risk by spreading investments across more companies and industries, making it a solid choice for those seeking a more comprehensive benchmark for portfolio management and market analysis. The S&P 500's diversity also makes it a better reflection of overall economic trends in the United States.


