ICT Unicorn Model Strategy: How To Use
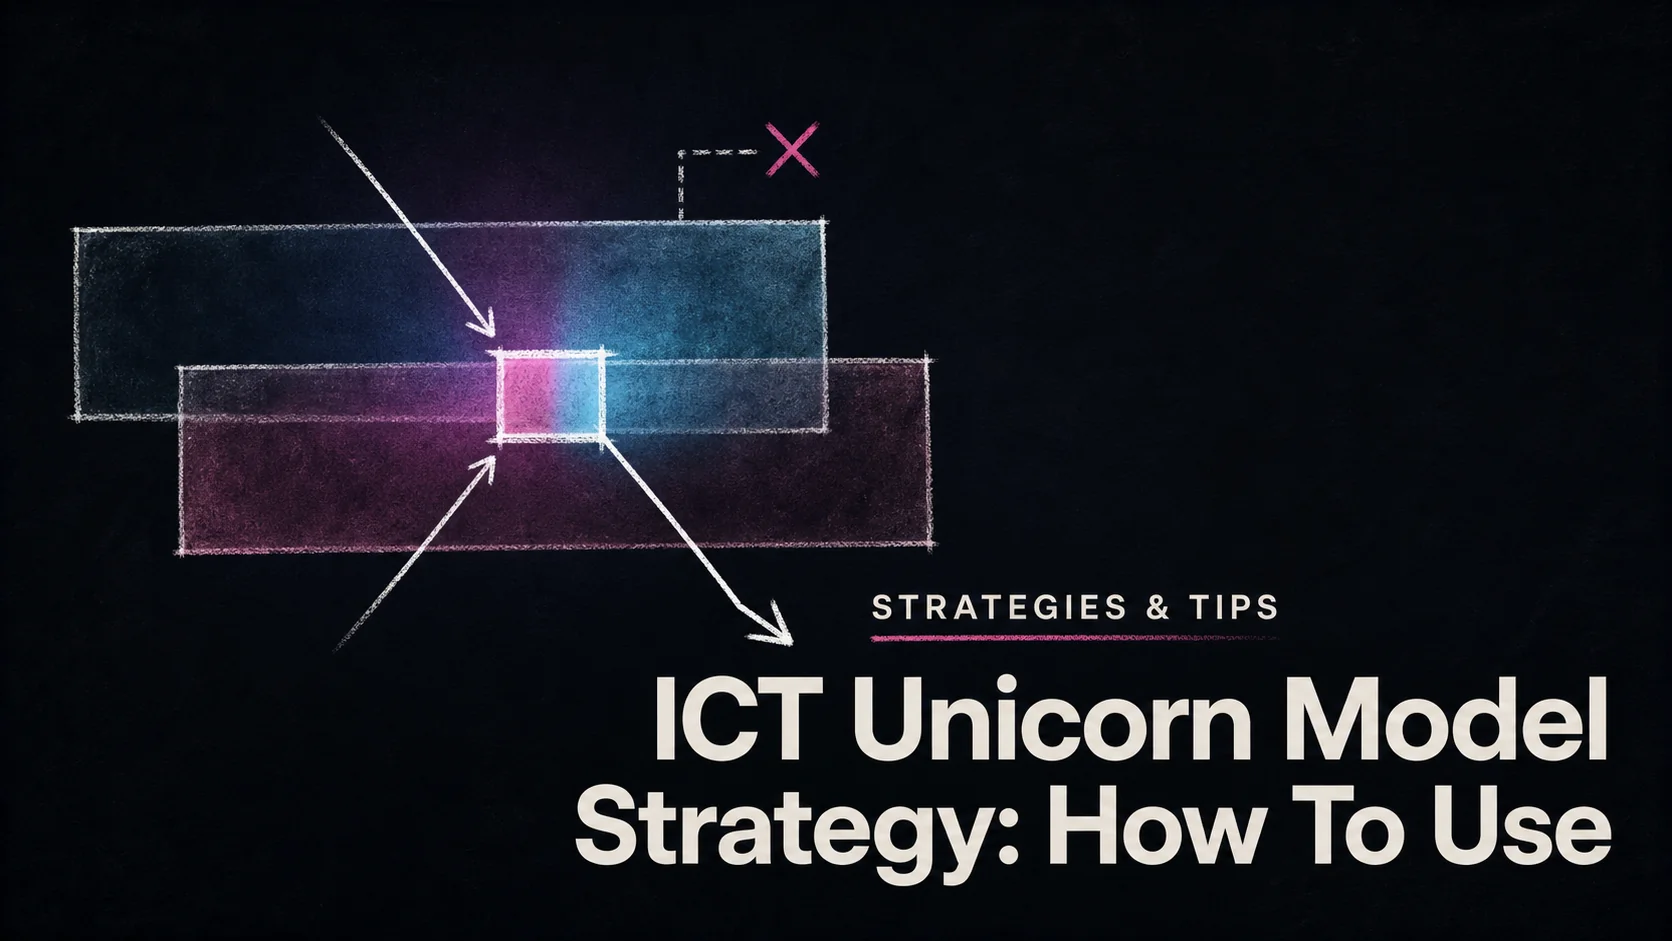
The ICT Unicorn Model Strategy combines a breaker block with an overlapping fair value gap, then looks for a qualifying retest. It provides a way to define a potential entry area, invalidation, and target. The pattern alone does not establish a high win rate or guarantee a reversal.
The practical sequence is structure shift → overlapping zones → retest → defined trade decision. Start by learning exactly how the zones are drawn. Then test the entry and risk rules you intend to use, including when the pattern was first knowable.
- Fair value gap: A three-candle relationship based on the first and third candles’ wick extremes.
- Breaker block: An invalidated order-block zone that is watched for a change of support/resistance role.
- Unicorn zone: The price range shared by the breaker and the directional FVG.
- Confirmation: A retest that meets the chosen implementation’s rules, rather than any touch of a rectangle.
You can study the free ICT Unicorn Model indicator in the LuxAlgo Library, open it on LuxAlgo charts, and use Quant, our coding agent, to help express a testable strategy around it.
Key Market Structure Concepts for the ICT Unicorn Model
Understanding Breaker Blocks
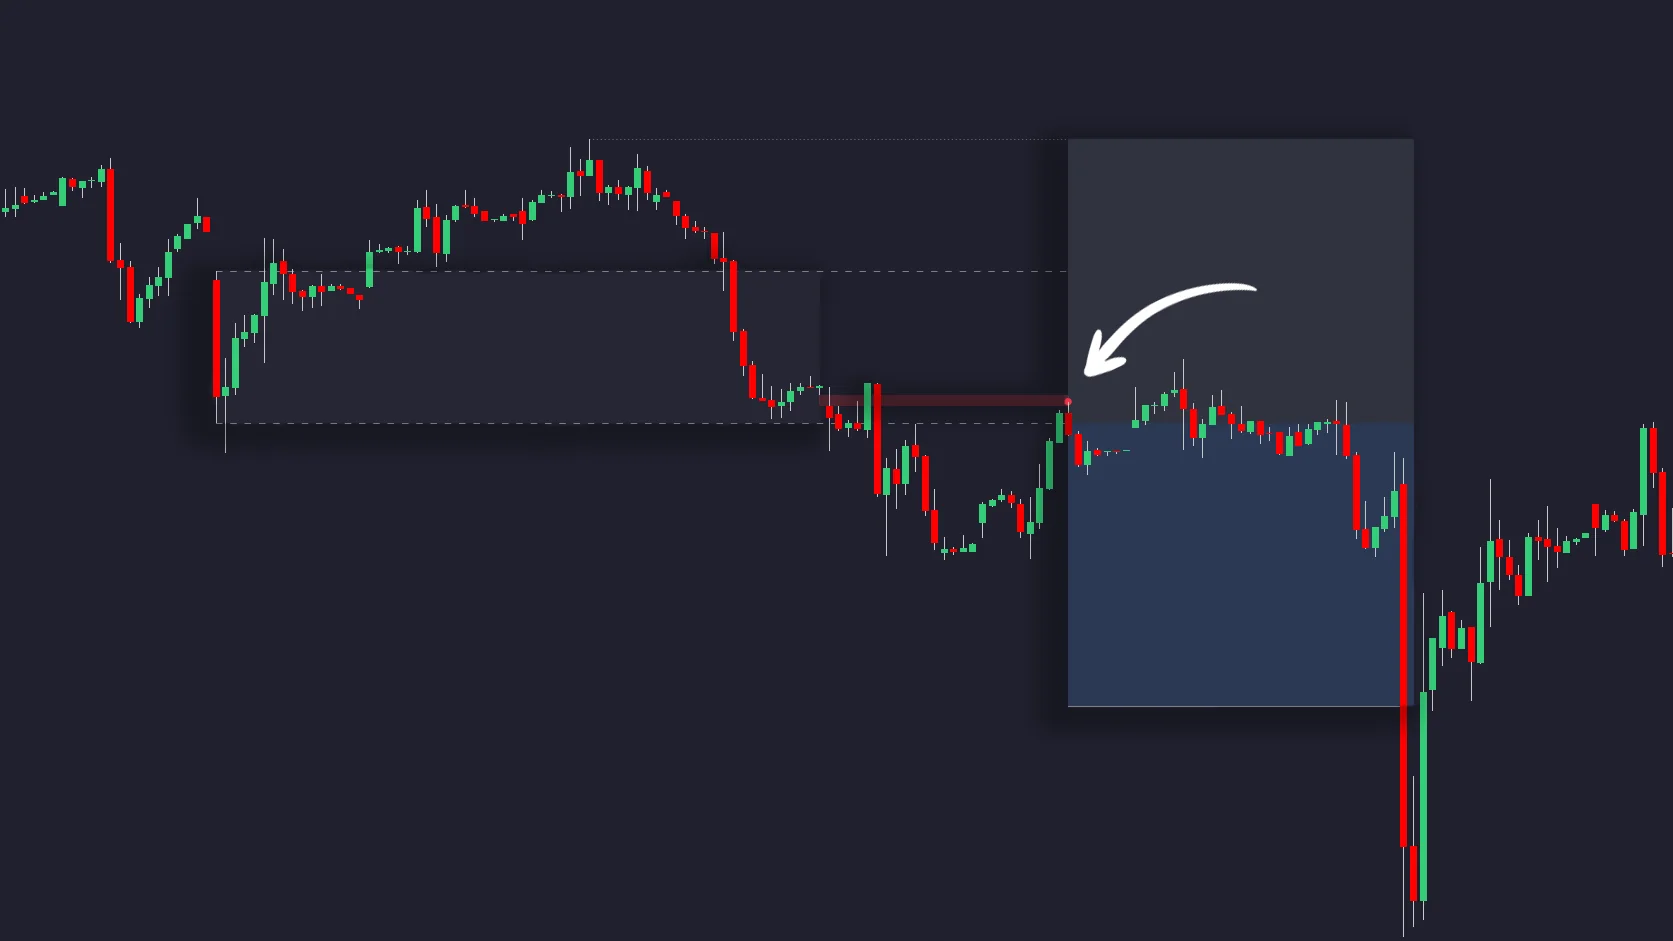
In ICT terminology, a breaker block develops when an order block fails and its zone is subsequently watched from the opposite side. A failed bearish block can become a bullish breaker; a failed bullish block can become a bearish breaker.
These are chart-based interpretations of price structure. A candle pattern does not prove that large institutions placed orders in the zone, that orders remain unfilled, or that traders’ stops are located at an exact price. Treat references to liquidity around swing highs and lows as a working hypothesis, not an observed order book.
Decide which swing sequence defines the setup and whether your block boundaries use candle bodies or full ranges. Implementations can differ. Changing those choices after seeing the outcome makes it difficult to evaluate the original rule.
Fair Value Gaps: Use the Correct Candle Boundaries
Number three consecutive candles from oldest to newest. Under the standard wick-based fair value gap definition:
- Bullish FVG: Candle 3’s low is above candle 1’s high. The gap extends from candle 1’s high to candle 3’s low.
- Bearish FVG: Candle 3’s high is below candle 1’s low. The gap extends from candle 3’s high to candle 1’s low.
This is not a comparison of candle 1’s close with candle 3’s open. The basic definition does not require all three candles to share one color; a particular script may apply additional displacement, size, or structure filters.
For example, if candle 1’s high is $100 and candle 3’s low is $102, the bullish FVG spans $100–$102. That non-overlap does not mean no trades occurred there during the middle candle. A later return into the zone is possible, but a full fill is not inevitable.
What Makes the Overlap Meaningful?
The Unicorn model adds a structural condition to the FVG. The two zones must share a price interval; simply being nearby is not the same setup. Confluence narrows the selection criteria, but it does not automatically improve results. Both zones are derived from price and should not be treated as independent proof of institutional activity.
Suppose a bullish breaker spans $99–$101 and a bullish FVG spans $100–$102. Their overlap is $100–$101. An entry anywhere in the full FVG is not necessarily an entry within that overlap. State which area your rule uses before assessing a retest.
Step-by-Step Guide to Using the ICT Unicorn Model
The official LuxAlgo tutorial below demonstrates the indicator and its chart patterns. Its recorded interface may differ from the current platform; the Library workflow later in this guide provides the current starting point.
1. Identify the Structure and Overlapping Gap
LuxAlgo’s published indicator description distinguishes the bullish lower-low-to-higher-high sequence from its bearish mirror. A qualifying gap must overlap the breaker, and a successful retest confirms the pattern. Detection and confirmation are separate stages.
| Component | Bullish setup | Bearish setup |
|---|---|---|
| Structure to examine | A low and high, followed by a lower low and then a break toward a higher high. | A high and low, followed by a higher high and then a break toward a lower low. |
| Directional gap | Candle 3 low above candle 1 high. | Candle 3 high below candle 1 low. |
| Zone relationship | Bullish FVG overlaps the bullish breaker. | Bearish FVG overlaps the bearish breaker. |
| Retest | Price returns and satisfies the selected bullish confirmation rule. | Price returns and satisfies the selected bearish confirmation rule. |
| Invalidation | A predefined adverse move below the relevant structure or zone. | A predefined adverse move above the relevant structure or zone. |
A chart label drawn at a prior swing does not necessarily mean that swing was confirmed on that candle. Swing and ZigZag methods can require subsequent bars. Check the actual detection time before using historical examples to judge entry quality.
2. Choose an Entry Rule Before the Retest
Choose between a resting order in the zone and a confirmation-based entry. For example, an educational rule might require price to trade into the overlap and then close back above its upper edge for a long. That is a rule to test, not a claim about the indicator’s exact default trigger.
A resting limit order can enter earlier but may execute while price is continuing through the area. A close-confirmed entry waits for more information but can enter farther from the stop or miss the move. Do not count the earlier price as your fill when your decision depends on a later close.
Also specify when an unused setup expires, whether a second retest is allowed, and what happens if a newer same-direction pattern appears. These choices can change the number and quality of trades substantially.
3. Define Invalidation, Then Calculate Size
Use a structural invalidation rule appropriate to the instrument and timeframe. A fixed buffer of 10–20 pips is not transferable across forex pairs, stocks, crypto, and futures. Tick size, spread, volatility, and contract value all matter.
Planned position size = cash risk budget ÷ estimated loss per unit. For shares, the estimate begins with the entry-to-stop distance and should include an allowance for costs. Futures require the monetary value of each point or tick; forex sizing requires the pip value in the account currency.
As a hypothetical example, use a $100 planned risk budget, a $101 entry, and a $99 stop. Before costs, 50 shares risk $100 at the intended exit. A $105 target offers $200 of potential gross profit, or 2R. If price gaps and the exit occurs at $98, the loss is $150 before costs. The stop level was not a guaranteed loss cap.
If the entry changes to $102 while the stop stays at $99, the distance becomes $3. With whole shares, the same budget allows 33 shares before costs, not 50. If the target stays at $105, the potential reward is now approximately 1R. Chasing the move changes the trade.
4. Set a Target That Fits the Available Structure
Prior swing highs, swing lows, and equal highs or lows can be reference levels. They are not guaranteed destinations or verified pools of executable orders. In ICT language, PD arrays are price-reference structures such as gaps and blocks; naming one does not establish that price will reach it.
If the nearest opposing structure leaves less reward than your plan requires, skip the setup or test a different exit rule. Do not move the target farther away simply to display a preferred ratio. A 1:2 target does not prove that realized winners will average twice the losses.
Investor.gov explains that stop-market execution can occur away from the trigger price, while a limit order may not execute. Confirm your broker’s order behavior before using either around a fast move.
Use the Free Unicorn Indicator on LuxAlgo Charts
Open the ICT Unicorn Model Library page and choose Open on Quant Charts. Select the instrument and interval you intend to study. The Library also provides source code for inspection and a TradingView access option.
The published controls include Swings, separate Bull and Bear toggles, Combine, Risk/Reward, and Trailing Stop. Swings changes the structure used for detection. Combine controls whether opposite-direction patterns coexist. Record the values you use so another review can reproduce the same setup.
The displayed stop and target areas are analytical drawings. They do not place broker orders, and an indicator appearing on a chart does not by itself establish an alert subscription or a backtested strategy.
Make the Rules Testable with Quant
Use Quant, our coding agent, to help turn a clearly specified setup into strategy code. Start with the indicator and explain the entry trigger, zone invalidation, expiration, position sizing, and target. Ask it to preserve confirmation timing rather than treating a retrospectively drawn swing as an earlier trading signal.
For example: “Build a research version of the Unicorn setup using completed bars. Allow one entry per confirmed pattern, cancel unused setups after a specified number of bars, and make the stop, target, and costs explicit. Explain when each signal becomes available.” Supply the actual parameters and review the code before running it.
Follow the Quant strategy workflow, then check Inputs and Properties, including capital, order sizing, commission, and slippage. A generated strategy needs verification against the intended rules; code generation is not validation.
In the strategy results and Trades Log, inspect individual entries and exits, trade count, drawdown, and performance. Compare the simulated entry with what the chart showed at that time. Check bars that touch both stop and target, since bar-level data may not establish their intrabar order without additional assumptions.
Keep a later period outside development, compare different conditions, and observe the setup forward before relying on it. Thirty to fifty trades may expose rule errors, but no fixed trade count or two-month window proves robustness. Repeatedly trying settings until the history looks attractive increases the risk of fitting noise.
Advanced Techniques: Add Context Without Overfitting
Use Momentum and Volume for Specific Questions
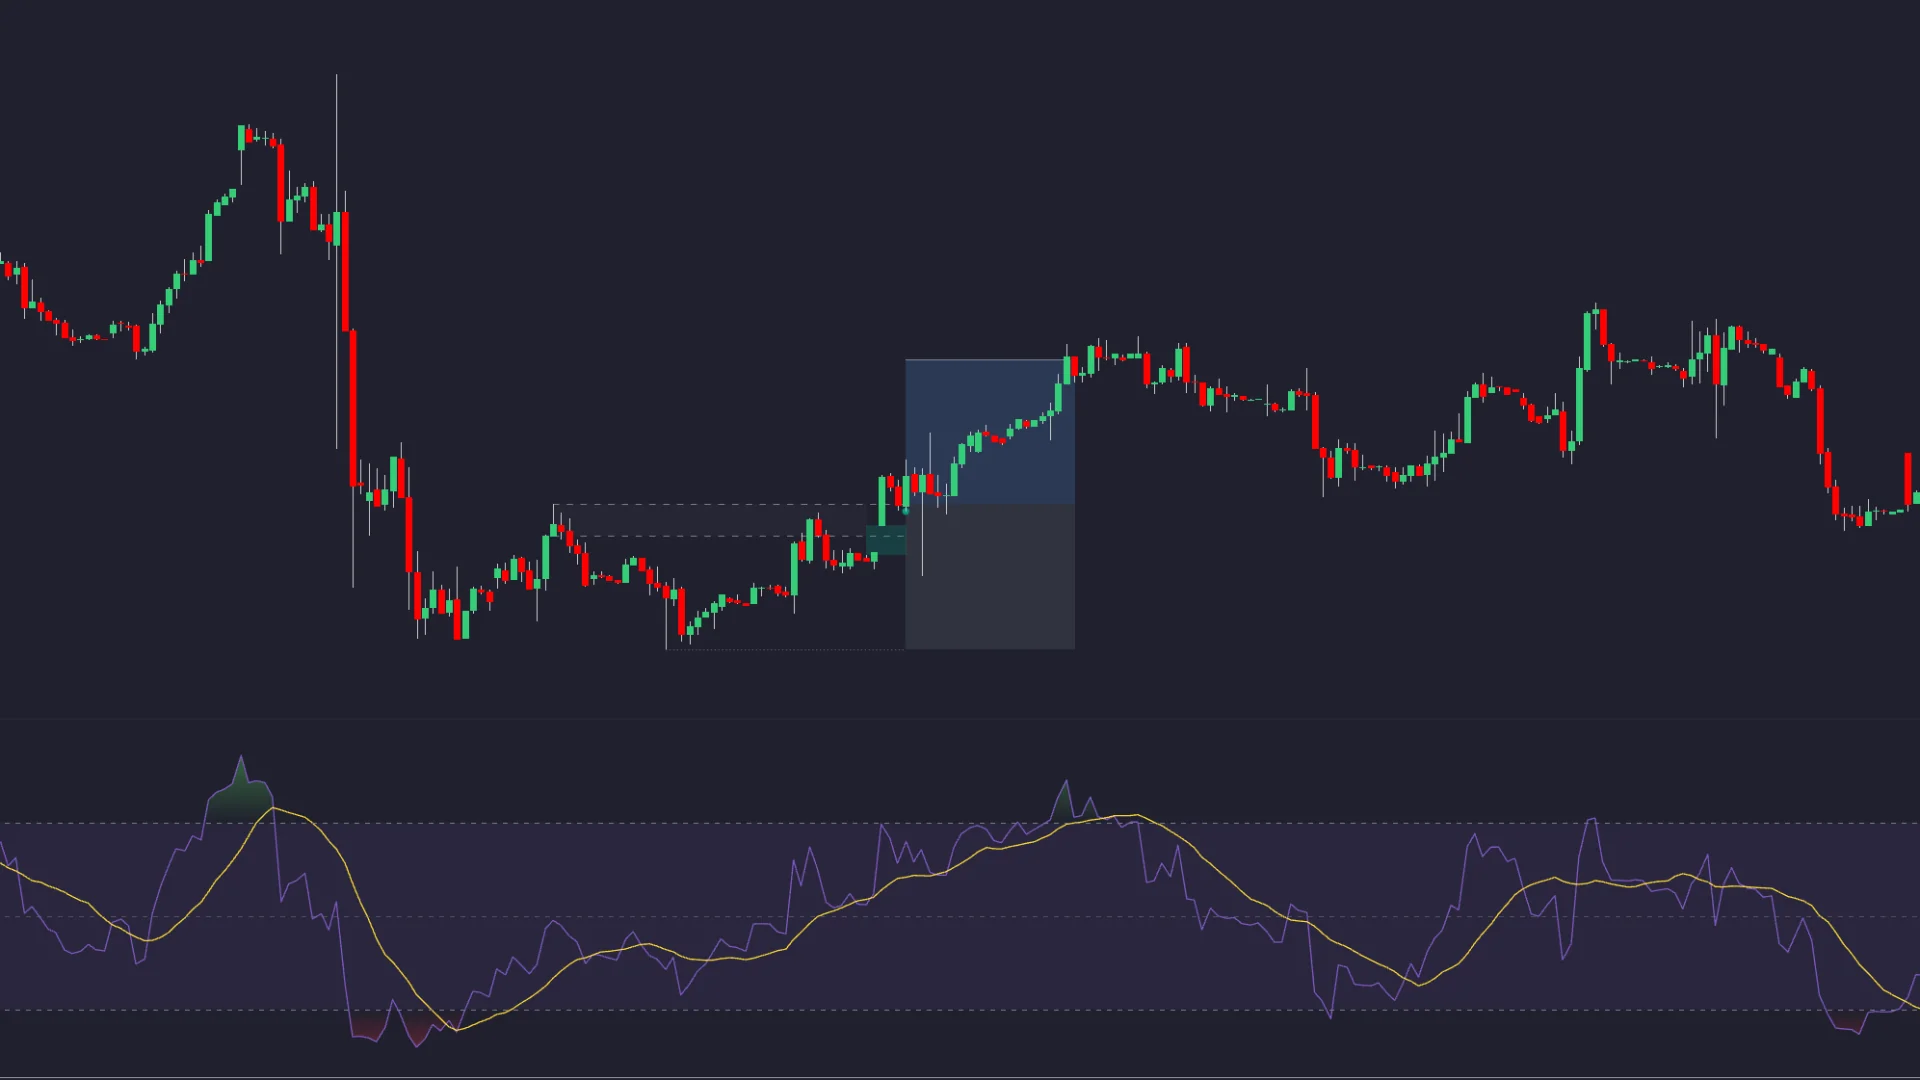
RSI measures recent gains relative to recent losses; it does not locate the close within the recent high-low range in the same way as a stochastic oscillator. MACD measures moving-average relationships. Both are derived from price, and neither reliably predicts the next reversal.
You could test an RSI recovery from oversold conditions or a MACD signal-line cross as an additional entry filter. Compare each version against the unfiltered setup using the same dates and costs. An extra condition can remove winners as well as losers, reduce the sample, and delay entry.
Volume profiles can help locate price areas with greater measured participation. They do not prove that an overlapping zone will hold. Check the market data coverage: an exchange-specific volume feed describes that venue, not necessarily the whole market. Use the same source when developing and reviewing the rule.
Use a Consistent Multi-Timeframe Plan
Select the role of each timeframe before looking for a trade. A higher interval might define context, a middle interval the structure, and a lower interval the entry. This is an organizational choice to test, not evidence that a five-minute chart is universally optimal.
| Illustrative approach | Context view | Setup or entry view | Question to resolve |
|---|---|---|---|
| Swing study | Weekly or daily | Daily or four-hour | How will overnight gaps and a wider stop affect exposure? |
| Intraday study | Four-hour or one-hour | Fifteen-minute or five-minute | Which session and completed context bars qualify the setup? |
| Very short-term study | One-hour or fifteen-minute | Five-minute or one-minute | Do spread, slippage, and signal delay consume the intended reward? |
Use completed higher-timeframe information when that is what your rule requires. An unfinished higher-timeframe candle can change after the lower-timeframe entry. TradingView’s repainting documentation explains why live and historical script behavior can differ, including future-data and plotting-in-the-past issues.
Adapt to Trending, Ranging, and Volatile Markets
In a trend, a directional filter can restrict the model to setups aligned with that trend. In a range, there may be less room before opposing structure. During news or sharp volatility, spreads and gap risk may invalidate an otherwise attractive chart pattern.
Choose any regime filter in advance and compare its effect on results. Bollinger Bands, ATR, horizontal levels, or oscillators answer different questions; adding all of them does not create automatic confirmation. If a wider stop is justified, reduce size to keep planned cash risk consistent. Deferring a trade is also a valid response.
Common Mistakes and How to Avoid Them
- Marking the wrong FVG: Use wick extremes and distinguish the actual overlap from the larger individual zones.
- Entering before confirmation: State whether the rule uses a touch, a close, or the indicator’s confirmation, then use only information available at that moment.
- Counting selected winners: Include failed, replaced, and unused setups according to the same recorded rules.
- Assuming a stop was targeted: A loss at a visible level does not prove manipulation. Review volatility, execution, and whether the invalidation made sense.
- Widening stops without resizing: Recalculate exposure, and do not expand risk simply to avoid accepting a loss.
- Overtrading: Define session, daily-loss, and setup limits before trading. A missed entry does not justify chasing the next candle.
Percentage risk limits should fit the account and strategy rather than alternate between contradictory fixed rules. Several positions on related markets or multiple timeframes can represent the same underlying exposure. Diversification does not prevent them from losing together.
Keep a journal with the symbol, timeframe, settings, zone boundaries, confirmation time, planned risk, actual fill, exit, and whether the rules were followed. LuxAlgo’s Journal can organize trade records for that review. Separate process mistakes from rule-compliant losses before changing the model.
Putting the ICT Unicorn Model into Practice
Start with one instrument, a fixed set of settings, and an explicit definition of overlap and retest. Review both successful and failed examples. Then use LuxAlgo charts and Quant to test whether the rules retain value after realistic costs and confirmation delays.
The model’s strength is that it gives you a concrete pattern to study. Whether it provides an advantage depends on the implementation, market, execution, and evidence—not the name of the setup or the number of confirmations on a chart.
FAQs
How do I identify Fair Value Gaps and Breaker Blocks to improve my trading strategy?
A bullish FVG lies between candle 1’s high and a higher candle 3 low; a bearish FVG is the reverse. A breaker is an invalidated order-block zone watched from the opposite side. For a Unicorn setup, require overlap and your predefined retest rule, then test the complete strategy.
What are the most common mistakes traders make with the ICT Unicorn Model Strategy, and how can they avoid them?
Common errors include using candle bodies instead of the chosen wick-based FVG definition, entering before confirmation, counting hindsight signals, and sizing without reference to the stop. Record exact rules, include losing setups, allow for costs, and avoid chasing missed entries.
How does the ICT Unicorn Model Strategy adapt to different market conditions, such as trending or volatile markets?
It does not adapt automatically. You can test trend, session, or volatility filters and change position size when the intended stop distance changes. Each variation needs consistent rules and fresh evaluation; some conditions may justify taking no trade.
Read next