
Learn how to effectively use Supply and Demand Arrow Zones to identify trading opportunities and improve your decision-making.
Supply and Demand Arrow Zones help traders identify key price levels where strong buying or selling pressure causes major price reversals. This strategy uses these zones to make informed trading decisions by analyzing price action, volume, and patterns. Here's what you need to know:
-
What Are Supply and Demand Zones?
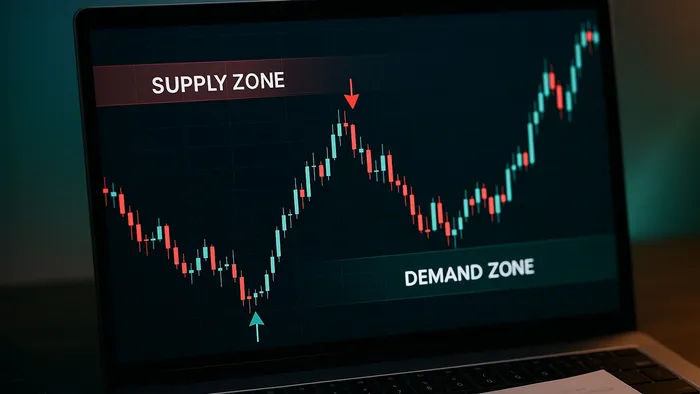
- Areas of sharp price changes signaling buyer-seller imbalances.
- Supply Zones: Strong selling after an upward move.
- Demand Zones: Strong buying after a decline.
-
How to Use These Zones:
- Identify zones with sharp reversals and volume spikes.
- Confirm zones by analyzing price behavior and volume trends.
- Use multi-timeframe analysis to refine entries and exits.
-
Key Trading Tips:
- Focus on untested zones for better reliability.
- Place stop-losses just outside the zone boundaries.
- Adjust strategies for trending, ranging, or low-liquidity markets.
This structured approach helps traders avoid emotional decisions and stick to clear, data-driven strategies. LuxAlgo’s Price Action Concepts toolkit can further enhance precision by automating zone identification and providing real-time confirmations.
Finding Supply and Demand Zones
How to Spot Strong Zones
Strong supply and demand zones emerge from clear, decisive price movements, signaling an imbalance in the market. These zones highlight areas where buyers or sellers dominate.
| Zone Type | Key Characteristics | Visual Indicators |
|---|---|---|
| Supply Zone | Sharp drop after an upward trend | Noticeable rejection and strong selling signs |
| Demand Zone | Quick rebound from lower levels | Clear rejection with strong buying activity |
| Consolidation | Tight range before a breakout | Periods of low volatility |
Look for candles with long wicks and higher-than-average trading volume. These visual cues often mark strong zones. Once identified, volume analysis can confirm their validity.
Price and Volume Analysis
Volume plays a crucial role in confirming supply and demand zones. Here’s what to watch for:
- Volume Spikes: Sudden increases in trading activity during market reversals.
- Price Velocity: Rapid price movements that underline the strength of a zone.
- Consolidation Patterns: Narrow price ranges before a significant move often indicate key zones.
The most reliable zones combine sharp price changes with noticeable volume increases. Historical data on reversals can further validate these zones by revealing consistent patterns.
Past Price Reversal Points
1. Multiple Timeframe Analysis
Check daily or weekly charts to locate major zones, then fine-tune your entries using smaller timeframes like 4-hour or 1-hour charts.
2. Pattern Recognition
Look for recurring signs of strong price reactions such as quick, decisive reversals, clear rejection of specific price levels, and consistent behavior during multiple tests of a zone.
3. Zone Validation
Confirm zones by analyzing price behavior when they are revisited, noting volume patterns that resemble earlier reversals and clear rejection at the boundaries of the zone.
Using the Price Map Strategy
Drawing Zones on Charts
Sharp reversals combined with volume spikes help identify key price zones. Mark these zones where significant shifts in price behavior occur.
| Zone Component | Placement Guide | Confirmation Signals |
|---|---|---|
| Upper Boundary | Start of reversal candle | Volume confirmation |
| Lower Boundary | Lowest price wick | RSI divergence below 30 |
| Zone Width | 1.5–3% price range | - |
For example, a Tesla (TSLA) Demand Zone at $220.00 in Q1 2025 saw a reversal after a 22% volume increase, illustrating how well-defined zones can guide trading decisions.
Entry and Exit Methods
Only trade when confirmation signals align with zone boundaries.
- Supply Zones: Enter trades after a 1-hour candle closes beyond the zone edge, supported by a dark cloud cover pattern and a 15% drop in bid size.
- Demand Zones: Place limit orders about 0.5% above the base of the zone. Look for a 3% surge in buy volume and confirm oversold conditions using RSI.
For stop-losses, position them 1–2% beyond the zone boundary. For instance, in NVIDIA's (NVDA) Demand Zone between $145.00 and $148.00, setting stops at $144.50 balanced protection with a strong risk-reward ratio.
Trading Different Market Types
Adjust your zone trading approach based on the market’s condition:
| Market Type | Strategy Adjustment |
|---|---|
| Trending | Focus on zones near the 50-day moving average for retracement opportunities. |
| Ranging | Trade between parallel Supply and Demand Zones. |
| Low Liquidity | Widen the zone by 0.8–1.2% and require three times the average volume spike. |
For instance, during the May 2025 crude oil rally, a Supply Zone at $85.50 per barrel failed after API data revealed a 4.2M-barrel inventory draw, showing how fundamental data can sometimes override technical signals.
In ranging markets, Gold's consolidation between $1,800 and $1,850 highlighted the effectiveness of trading between established zones. However, zones older than three months tend to lose reliability, so prioritize newer formations.
Price Action Concepts Toolkit: Premium, Equilibrium, and Discount Zones
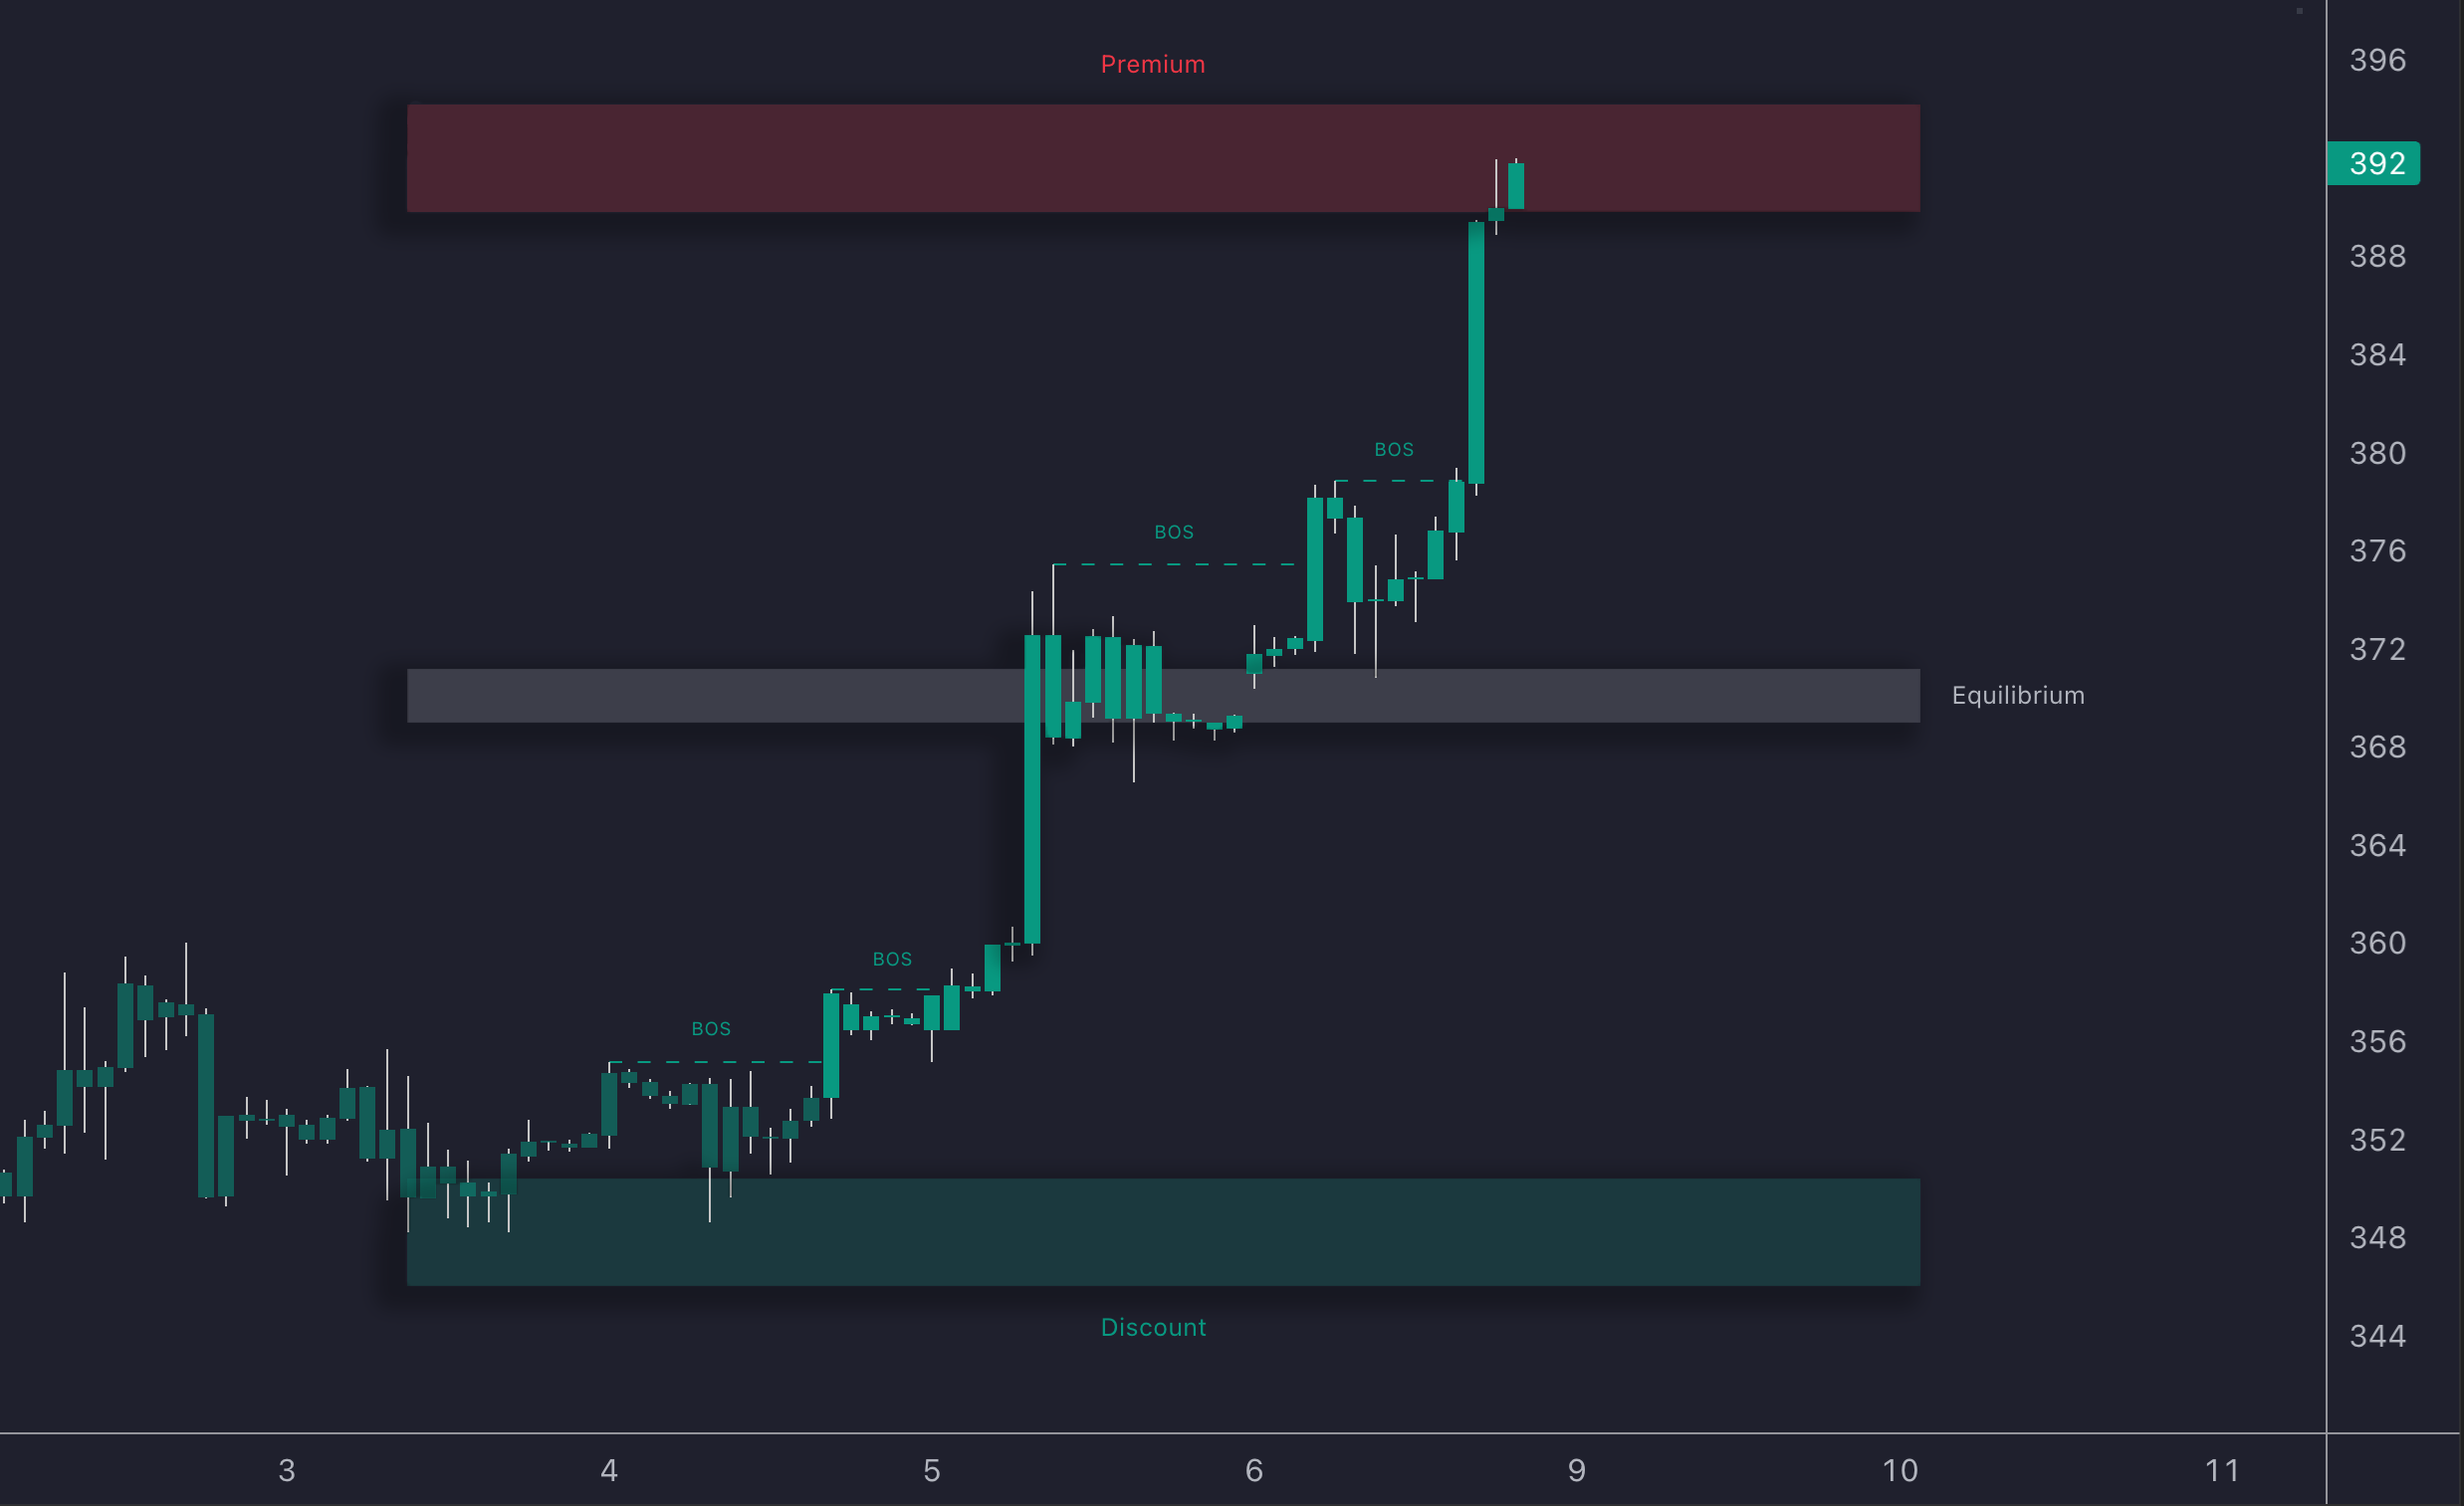
The Price Action Concepts (PAC) toolkit automatically shades three key areas within each swing range: the Premium zone at the top, the Equilibrium zone in the middle, and the Discount zone at the bottom. These areas allow traders to see whether price action is occurring at a premium, within fair value, or at a discount. [oai_citation:0‡docs.luxalgo.com](https://docs.luxalgo.com/docs/toolkits/price-action-concepts/pdzones)
- Premium Zone (upper area) often acts as resistance and can highlight stretched prices where short-biased setups are more attractive.
- Equilibrium Zone (middle area) marks fair value where price may consolidate before choosing direction.
- Discount Zone (lower area) often acts as support and can highlight attractive entries for long-biased setups.
Conditions suggesting an uptrend that form inside the Discount zone tend to carry extra weight, while bearish conditions in the Premium zone can precede reversals. [oai_citation:1‡docs.luxalgo.com](https://docs.luxalgo.com/docs/toolkits/price-action-concepts/pdzones)
| Feature | Function | Trading Impact |
|---|---|---|
| Enable Premium/Discount Toggle | Turns zone shading on or off in settings | Quickly visualises optimal trade areas on the chart [oai_citation:2‡docs.luxalgo.com](https://docs.luxalgo.com/docs/toolkits/price-action-concepts/settings) |
| Dynamic Updates | Zones move as new swing highs and lows appear | Keeps analysis aligned with fresh structure |
| Confluence Layer | Combines with order blocks or market-structure breaks | Reinforces reliability when signals overlap |
| Custom Parameters | Adjust range source, look-back length, and colours | Fits any timeframe or strategy style |
When price is trending up, pullbacks into the Discount zone can hint at accumulation, whereas pushes into the Premium zone during a downtrend can flag distribution. Traders can quickly test these reactions by sending prompts to the LuxAlgo AI Backtesting Assistant to see historical win rates when entries coincide with Premium or Discount areas.
Trading Tips and Guidelines
Timeframe Selection
Use specific timeframes to pinpoint and refine trading zones:
| Timeframe | Purpose |
|---|---|
| 4H / Daily | Identify major zones |
| 1H / 30min | Confirm potential entries |
| 15min / 5min | Fine-tune entry points |
Start with the broader view on higher timeframes to spot key zones, then shift to lower timeframes to refine and confirm your entry points. Incorporating volume analysis at this stage can further validate the zones.
Volume-Based Confirmation
Volume analysis is crucial for confirming the strength of identified zones. Look for noticeable volume increases during consolidation phases and pay attention to heightened activity during New York trading hours. These volume patterns can boost confidence in trades, especially when they align with previously marked zones.
Prioritizing Untested Zones
Zones that haven’t been tested tend to be more reliable for trading setups:
- Sharp, decisive price movements strengthen a zone's significance.
- Zones retested multiple times lose impact over time.
- Focus on newly formed zones for the best opportunities.
Summary
Strategy Overview
This approach focuses on identifying key price levels where buyer-seller imbalances often lead to reversals. It relies on three main elements:
- Zone Recognition: Identifying areas of sharp price changes that suggest supply-demand imbalances.
- Multi-timeframe Analysis: Using multiple timeframes to locate precise zones.
- Volume Confirmation: Checking volume patterns to confirm the strength of these zones.
By mapping zones, analyzing volume, and working across timeframes, you can fine-tune your entry and exit points.
Getting Started Steps
-
Initial Setup and Zone Identification
- Use the LuxAlgo Price Action Concepts toolkit to automatically highlight zones.
- Focus on higher timeframes like 4H or Daily for mapping zones.
- Look for sharp price moves accompanied by volume spikes.
- Prioritize newly formed zones.
- Validate potential zones with volume analysis tools.
-
Implementation Strategy
Phase Action Validation Planning Identify key zones Cross-check historical data Analysis Monitor volume trends Confirm signals from volume Execution Wait for retests Verify signals on lower timeframes Refine zone timing with the LuxAlgo AI Backtesting Assistant and extend analysis to different markets.
"LuxAlgo exactly allows me to see the market faster and confirm entries / exits and it's amazing!" – Çağrı Güler
"Lux Algo has really stepped my trading up, there is a setup for any style of trading you prefer which is very nice you don't have to put yourself in a box metaphorically speaking." – Kevin Ortega
FAQs
How can traders use multi-timeframe analysis to make supply and demand zones more reliable?
Multi-timeframe analysis involves checking price zones across higher and lower timeframes. Identify major zones on the daily chart, confirm trends on a 4-hour chart, and refine entries on a 1-hour chart. Aligning these zones helps validate institutional activity and strengthens confidence in your strategy.
How does volume analysis help confirm supply and demand zones, and how can traders use it effectively?
Volume analysis highlights market participation. A zone forming with high trading volume suggests strong interest, making it more reliable for future reactions. Look for volume spikes during zone creation and monitor whether volume falls within the base of a pattern, which can hint at accumulation or distribution.
How can LuxAlgo's tools improve accuracy when applying the Supply and Demand Arrow Zones Price Map Strategy?
LuxAlgo's Price Action Concepts toolkit automatically highlights supply and demand zones and shades premium or discount regions, helping traders quickly locate high-probability areas. Combining these automated cues with manual volume and pattern analysis leads to well-informed decisions.


