Bollinger Band Fade vs Break — Which Works Better
Neither Bollinger Band fades nor breaks work better in every market. A fade looks for an excursion that fails and returns toward the average. A break looks for price to continue beyond a band. The better choice depends on the entry rule, market conditions, exits, costs and the results of a fair test.
LuxAlgo’s charting and AI platform gives you a way to compare those hypotheses. Study the bands and price behavior on Quant Charts, then use Quant, our coding agent, to help build two explicit strategies. Inspect the code and test both on the same data before deciding which fits your process.
Quick Comparison: Fade vs. Break
| Factor | Fade strategy | Break strategy |
|---|---|---|
| Core hypothesis | An extended move fails and returns toward the mean | An outside-band move develops into continuation |
| Typical setup | A return inside a band near a defined range boundary | A close beyond a band with a defined momentum or expansion condition |
| Primary vulnerability | Price keeps trending against the fade | The breakout fails and returns into the range |
| Holding period | Determined by target, stop and time exit | Determined by target, trailing rule and time exit |
| Win rate and payoff | Must be measured for the specific rules | Must be measured for the specific rules |
John Bollinger’s official rules make a crucial distinction: touching a band is not itself a buy or sell signal. Prices can travel along a band in a trend, and closes outside the envelope can indicate continuation. Fading every upper-band touch or buying every breakout ignores that context.
Read the Bands Before Choosing a Strategy
The traditional starting point is a 20-period simple moving average with upper and lower bands two standard deviations away, calculated from the same price series and window. These are defaults, not universally optimal parameters. The LuxAlgo Bollinger Bands guide explains the construction.
BandWidth measures separation relative to the middle band: ((upper − lower) ÷ middle) × 100 in percentage form. With bands at $102 and $98 around a $100 middle band, BandWidth is 4%. A display using the raw ratio would show 0.04. A fixed threshold such as 2% does not classify every instrument or timeframe correctly.
Narrow bands indicate low recent dispersion, not a guarantee of a stable trading range. A squeeze can precede expansion in either direction. Wide bands likewise do not prove a tradable trend: a volatile range can expand them too. Review actual swings, slope and price behavior alongside width.
How the Bollinger Band Fade Strategy Works
Basic Rules of Fade Trading
A fade takes the other side of an excursion after evidence that it is failing. For a possible long, price trades below the lower band and then closes back inside; the bearish version follows a failed move above the upper band. A double bottom, M-top pattern or another predefined price condition can be an additional filter, but the pattern must be confirmed using information available at entry.
- Identify a range or mean-reversion hypothesis before the entry signal.
- Define the band excursion and return condition, including whether you require a completed close.
- Choose an entry order and specify when it is submitted.
- Place the stop at a defined invalidation and calculate size from that distance.
- Specify the target and expiry before entering.
Volume can add context, but high volume at a band is not proof of reversal. It can also accompany a powerful breakout. Compare what happened after the excursion rather than assigning a stronger reversal probability from volume alone.
Market Conditions to Evaluate for Fades
A range with repeated failures at its boundaries may support a fade hypothesis. A relatively flat middle band can be one filter, provided “flat” has a measurable definition. Low volatility alone is insufficient, and a persistent trend can repeatedly punish countertrend entries.
Session labels are also incomplete rules. For example, an EUR/USD Asian-session fade test and a London–New York overlap breakout test involve different liquidity, costs and sample composition. Define the timezone and daylight-saving treatment and compare enough observations. Do not attach a universal success rate to either session.
Entry Points and Risk Controls
One model targets the middle band after a return inside the outer band. Another waits for price to cross the middle band and targets the opposite side. These are different strategies: the second enters later and has a different remaining reward. Do not report their results as one setup.
For a hypothetical long fade, assume an actual entry at $98, a fixed stop at $96 and a target at $101. The initial risk is $2 per share and the target offers $3, or 1.5R before costs. If the target follows a moving middle band instead, specify how often it updates; its payoff is no longer fixed at 1.5R.
Use the actual swing and volatility context to define invalidation. A stop “1%–2% away” is a separate percentage rule, not automatically the same as a stop beyond a swing. A small account-risk percentage can still produce a large position if the assumed stop is unusually tight.
How the Bollinger Band Break Strategy Works
Basic Rules of Break Trading
A break strategy follows an outside-band move. A simple long version requires a completed close above the upper band; the short version requires a completed close below the lower band. A squeeze, rising BandWidth, range break or momentum condition can be added, but each changes which trades qualify.
Specify whether the comparison uses the current band at the completed close or a prior-bar band. Since the band itself updates with price, those definitions can produce different signals. Also specify whether entry occurs on the next available price or after a retest.
Market Conditions to Evaluate for Breaks
Breakouts seek sustained directional movement. A move emerging from compression can be useful to study, but a longer squeeze does not guarantee a larger or more profitable breakout. High volatility can mean opportunity, whipsaws, wider spreads or all three.
Scheduled news, including FOMC announcements, can change execution conditions rapidly. A news-driven move is not automatically suitable for a break strategy, and a fade does not have a fixed failure probability during those events. Compare event and non-event samples with realistic fills rather than assigning success percentages without evidence.
Signal Confirmation and Risk Controls
Possible stops include a fixed initial ATR distance, the breakout range boundary or an opposite-band rule. Choose one and specify whether it moves after entry. An opposite band may be far from the entry; calculate the resulting position size rather than assuming it is a low-risk default.
For example, a hypothetical breakout entry at $104 with a stop at $100 and target at $114 risks $4 to seek $10 per share, or 2.5R. With a $100 planned risk budget, the position is 25 shares before costs. If a gap produces an exit at $98, the loss is $150. Targets, stops and an attractive planned ratio do not guarantee those fills.
If ATR at entry is $2 and the initial stop uses two ATRs, its distance is $4. State whether that initial value is frozen or recalculated. A trailing stop should have an explicit tightening rule; recalculating from a larger ATR can otherwise widen risk unintentionally.
Fade vs. Break Strategy Analysis
Compare Expectancy, Not Just Win Rate
There is no defensible universal win rate, holding period, margin premium or drawdown advantage for these broad labels. A meaningful comparison needs the instrument, timeframe, date range, number of trades, entry and exit rules, execution assumptions and all trading costs.
Use the measured average win and loss, not merely the target-to-stop ratio. In units of initial risk:
Expectancy = win probability × average win − loss probability × average loss − average costs.
The following numbers are hypothetical arithmetic examples, not measured Bollinger strategy performance. Assume losses average 1R and costs average 0.05R per trade.
| Example | Assumed win rate | Average win | Expectancy after assumed costs |
|---|---|---|---|
| Fade illustration | 50% | 1.5R | 0.50 × 1.5 − 0.50 × 1 − 0.05 = 0.20R |
| Break illustration | 40% | 2.5R | 0.40 × 2.5 − 0.60 × 1 − 0.05 = 0.35R |
This shows why a lower win rate can coexist with a higher expectancy under particular assumptions. It does not establish that breakouts outperform fades. If average wins fall short of targets, losses exceed stops or costs rise, the result changes. Before costs, a fixed 1.5R win versus 1R loss requires a 40% win rate to break even; a 2.5R win requires about 28.6%.
Compare drawdown, losing streaks, trade count, exposure time, turnover and the distribution of returns as well. Margin depends on the product, broker and position size. Neither method inherently requires 38% more margin, a fixed number of daily setups or a smoother equity curve.
Advantages and Limitations
| Approach | Potential advantage | Failure mode to test |
|---|---|---|
| Fade | A nearby invalidation and mean target can give a clear trade plan | Repeated stop-outs as price walks a band in a trend |
| Break | Can participate in an extended directional move | False breaks, late entry and giving back gains before a trailing exit |
| Both | Rules can be applied across different instruments and intervals | Parameter selection, overfitting and execution costs can erase apparent gains |
Intraday fades may require frequent monitoring, while some breakout rules hold longer. Those are consequences of the selected exits and timeframe, not fixed fifteen-to-thirty-minute or two-to-eight-hour characteristics. Test M15, M30, H4 or daily data as distinct configurations rather than calling one the most accurate without a comparable sample.
Combining Strategies Without Hindsight
If you use both, define the regime switch before examining the trade’s outcome. For example, a candidate model might permit fades only when the middle-band slope is below a chosen threshold and permit breaks only after a specified BandWidth expansion. State the units, lookback and what happens when neither or both conditions qualify.
RSI, MACD, moving-average slope and Keltner Channels can provide additional conditions. RSI and MACD both describe aspects of momentum, so more indicators do not necessarily add independent evidence. A Bollinger-inside-Keltner squeeze is also a different rule from a low BandWidth reading.
Compare the combined model with each standalone approach after costs. Freeze the rules before an out-of-sample test, include losing periods and avoid changing the strategy label after a failed trade. An RSI divergence filter or a longer squeeze window is not automatically an improvement.
Using LuxAlgo for a Fair Comparison
Study Both Setups on Quant Charts
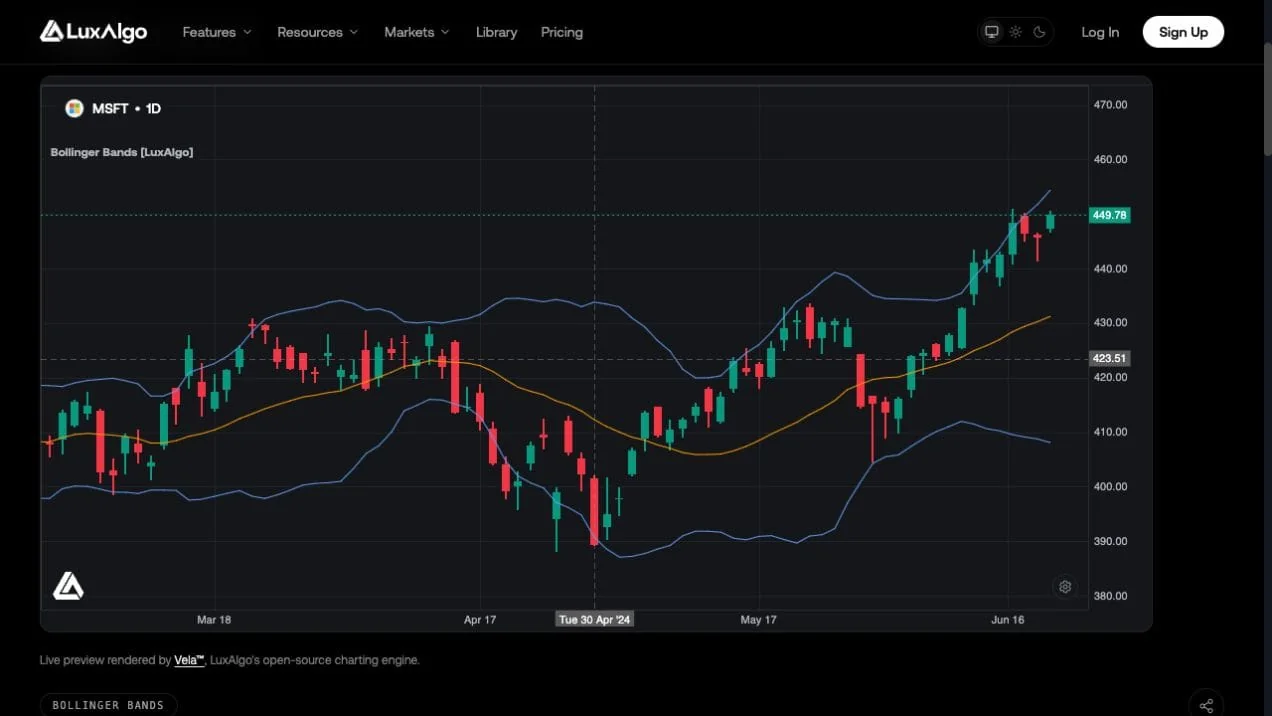
Open Quant Charts and use the Bollinger Bands Library indicator to inspect the same market and interval. Its settings include length, source and multiplier, with Bands, %B and Bandwidth display modes. Its outer-band cross alerts identify events; they do not implement every fade or break rule in this guide.
LuxAlgo Library Tools as Filters
The Library’s market-structure and trend tools, built into Quant Charts, free to start, can supply explicitly defined filters, but their conditions are not identical to Bollinger fade or break rules. Confirm the exact event, timeframe and bar-close behavior before relying on an alert; it can prompt a review but does not manage position risk.
Strategy Testing with Quant
Use Quant, our coding agent, to help write two strategies from the same baseline. Give it precise entry, exit, position-sizing and regime rules. Require the same price feed, test dates, initial capital, costs and execution assumptions so the comparison remains meaningful.
Follow Making Strategies with Quant: open Code, inspect the generated script and click Run yourself. Then use the native backtest guide to review individual trades and summary metrics. Check unfilled limits, next-bar entries, gaps and bars that touch both a stop and target. Code that runs can still contain incorrect trading logic.
A backtest with Quant does not prove optimal parameters. Test a manageable set of hypotheses, record every variation and retain an untouched period. TradingView’s strategy testing documentation explains common fill assumptions, costs and biases to watch for.
Conclusion
A fade is a mean-reversion hypothesis; a break is a continuation hypothesis. Neither earns a fixed win rate from its name. Choose based on precisely defined rules, realistic costs, drawdown tolerance and evidence from data the strategy was not tuned on.
Use Quant Charts to inspect the setup, the appropriate LuxAlgo tools to make the conditions explicit, and Quant to help build a comparison you can review and run. If neither version meets your criteria, staying out is a valid result of the test.
FAQs
How do I choose between a Bollinger Band fade and a break?
A fade looks for a failed excursion returning toward the mean, while a break seeks continuation outside a band. Define the market filter, entry and exit rules before testing. Band width alone does not reliably separate ranges from trends.
Is an upper-band touch a sell signal?
No. Price can remain near or beyond an outer band during a trend. A fade needs its own failure or return condition, and a breakout needs an explicit entry rule. A band touch is context rather than a complete trade signal.
Which strategy has a higher win rate?
There is no universal rate for either strategy. Compare defined rules on the same instrument, dates and execution assumptions, including costs. Measure average wins, losses and drawdown as well as win rate; a higher win rate alone does not establish a better strategy.
Can RSI, MACD or Keltner Channels improve the comparison?
They can add specific filters, but improvement must be measured. Related indicators may duplicate information, and a Bollinger-inside-Keltner squeeze differs from a low BandWidth rule. Test each addition on data that was not used to select it.
How can Quant help test fade and break strategies?
Quant can help generate code from explicit rules. Inspect that code and run it manually, using the same data, costs and risk assumptions for both strategies. Check individual fills and out-of-sample results. Generated code and historical profits do not guarantee correct logic or future performance.
References
LuxAlgo Resources
- Bollinger Bands: Concept Guide
- Bollinger Bands Indicator
- Quant Charts
- LuxAlgo Quant
- Making Strategies with Quant
- Native Backtest Guide
- RSI
- MACD
- Keltner Channels
- LuxAlgo Pricing
External Resources
Read next