Volume Analysis Techniques: Confirm Your Setups
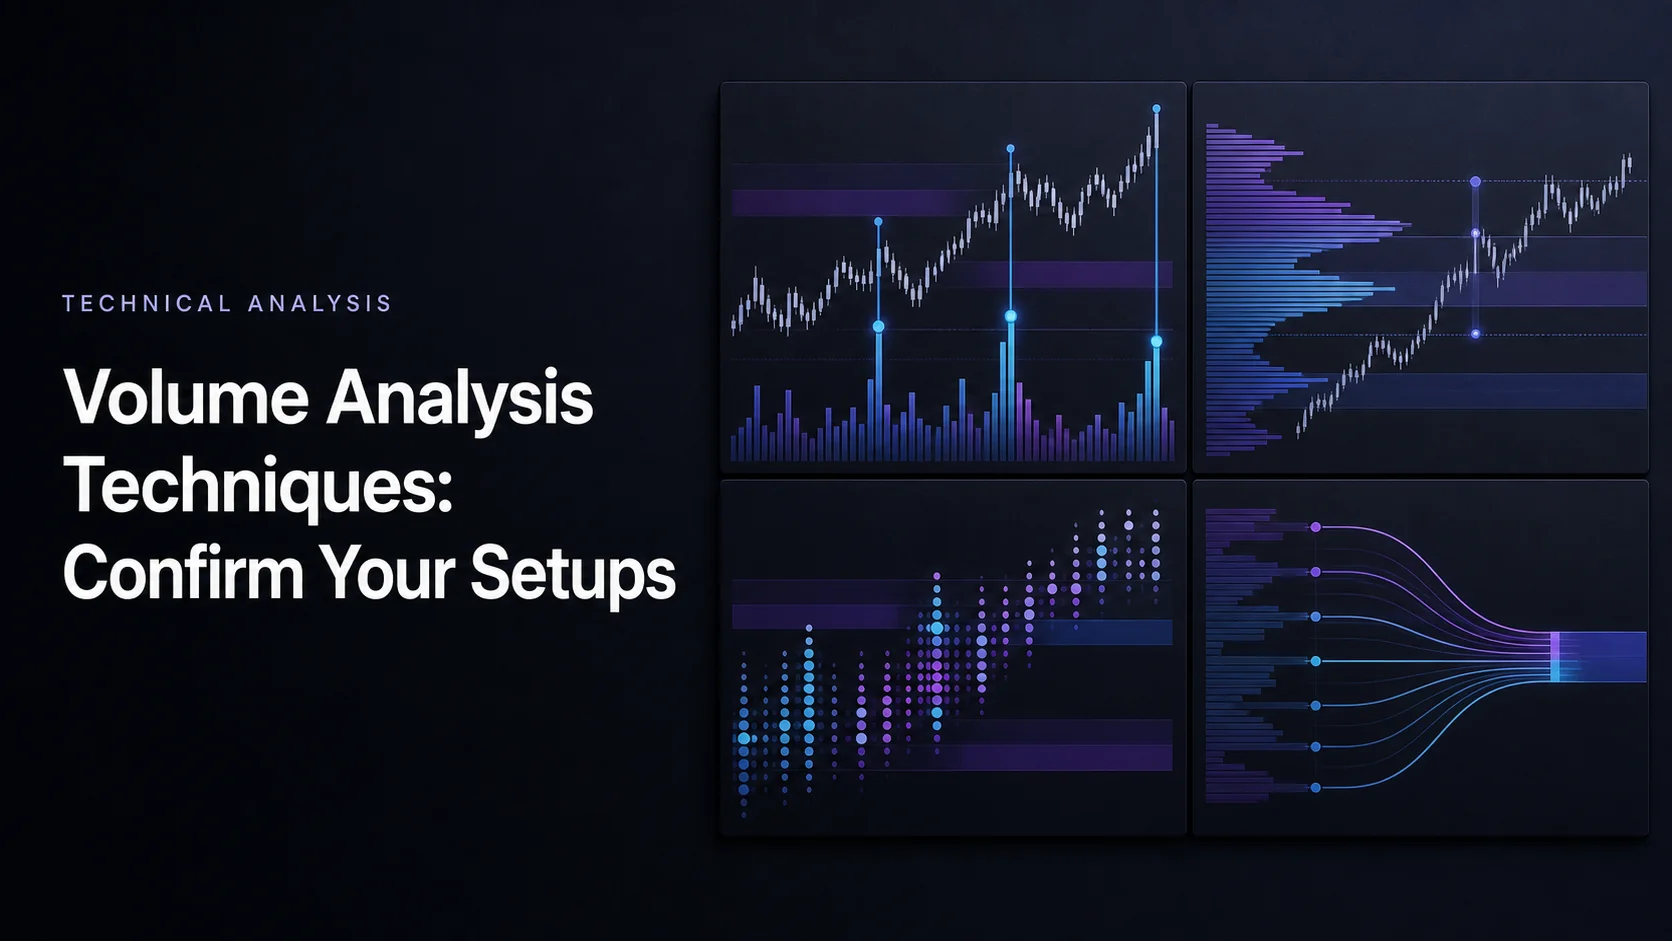
Volume analysis can add context to a trading setup by showing how much activity accompanied a price move. It does not turn a breakout, hammer, or engulfing candle into a guaranteed signal. The useful question is whether a precisely defined volume condition improves the same trading rule after costs.
Start on LuxAlgo’s native charts with the price level, volume baseline, and profile window you intend to study. Then work with Quant to implement a testable rule, review its logic, and compare the result with the price-only setup.
Three Volume Analysis Methods for Checking Setups
| Method | Question it answers | Useful application | What it cannot establish |
|---|---|---|---|
| Volume spikes | Is activity unusually high relative to a specified baseline? | Compare activity during a breakout or level test | Whether the move must continue or reverse |
| Volume Profile | Where did activity concentrate across price levels? | Mark historical zones before evaluating a reaction | Institutional identity or guaranteed support and resistance |
| Volume divergence | Is activity or a volume-derived indicator failing to track price? | Investigate a possible change in participation | The timing or certainty of a reversal |
1. Measure Volume Spikes Against a Defined Baseline
A spike is meaningful only relative to a comparison. Specify the lookback, whether the current bar is excluded, and whether you are comparing whole sessions, individual bars, or activity accumulated to the same time of day.
If a completed bar trades 200,000 units against an average of 100,000, it has twice the average volume—a 100% increase. Three times average is a 200% increase. 150% of average means 1.5 times average, while a 150% increase means 2.5 times average. These are different thresholds.
Neither 2× nor 3× volume universally separates continuation from reversal. High activity can accompany a breakout, a failed move, a news reaction, or two-way trading at a level. Decide which price behavior is required before treating the setup as actionable.
Intraday comparisons need particular care. Relative Volume at Time compares activity at corresponding historical offsets. A partially completed bar or session can distort a comparison with completed periods. Record the session and time zone instead of assuming every trading hour has the same normal volume.
2. Use Volume Profile to Map Price Zones
A profile distributes volume across price bins in a selected window. The Point of Control (POC) is the highest-volume row. High Volume Nodes show concentrations; Low Volume Nodes show valleys. The value area contains a chosen share of historical volume, commonly 70%, with Value Area High and Low marking its boundaries.
These are historical reference levels. A POC is not guaranteed to draw price toward it, and a 70% value area is not a 70% probability forecast or proof of fundamental fair value. An LVN does not measure the current order book’s depth.

LuxAlgo’s native Volume Profiles include Session, Rolling, and Visible Range. Session and Rolling use supported footprint data; Visible Range uses candle volume and changes as you pan or zoom. Its up/down colors are not an aggressor buy/sell classification. Check data coverage before choosing a method.
For a range setup, watch the specified reaction near the value-area boundary. For a breakout, define what counts as acceptance beyond the level. Simply touching VAH, VAL, or POC is not the same as meeting an entry condition. See the Volume Profile map guide for more detail.
3. Define Volume Divergence Precisely
Rising price with declining raw volume describes a change in participation over the chosen interval. Divergence in a cumulative or rolling indicator is more specific: regular bearish divergence compares a higher price high with a lower indicator high, while regular bullish divergence compares a lower price low with a higher indicator low.
Name the indicator and compare corresponding swings. OBV, CMF, and CVD use different calculations, so their divergences are not interchangeable. CVD also needs a consistent anchor and data method.
A divergence may persist as price continues trending. Higher timeframes add context, but there is no universal accuracy improvement from combining daily, four-hour, and one-hour charts. Those views overlap. If a pivot needs later bars to confirm, the signal was not available at the earlier swing itself.
Turn Volume Context into a Trading Plan
Separate the Location, Trigger, and Risk Rule
- Location: Mark a support, resistance, or profile zone using information already available.
- Price trigger: Specify the close, rejection, retest, or pattern completion required for entry.
- Volume condition: Define the baseline, threshold, indicator, and timing.
- Invalidation: State the price or condition that makes the setup wrong.
- Position size: Calculate size from the risk budget, stop distance, instrument value, and execution allowance.
For a hammer or bullish engulfing setup, define the candle geometry and preceding context first. Then compare the same rule with and without a volume filter. A threshold above 150% of average is an experiment to evaluate, not an established reliability requirement for every market.
A Worked Breakout Example
Suppose a hypothetical stock has a premarked resistance zone at $120. A completed breakout bar trades 182,000 shares against a 100,000-share comparison average: 1.82× average, or an 82% increase. That observation does not prove accumulation or promise a particular subsequent rally.
If the strategy calls for entry at $121, a structural stop at $118, and a target at $127, the gross target distance is $6 against a $3 stop distance. With a $300 risk budget and $0.15 per share in estimated trading costs, size is floor($300 ÷ $3.15) = 95 shares, or $299.25 of planned risk.
If the required price trigger never occurs, there is no trade under this rule. If it does occur, the trade can still lose. Account for other open exposure, and remember that gaps and slippage can exceed the planned loss. CME’s position-sizing guidance explains why stop distance and size belong together.
Test the Setup with Quant
Give Quant the exact formula and baseline rather than asking it to “confirm strong volume.” Include the symbol, timeframe, session, entry condition, stop, target, and sizing rule. Review how the generated strategy handles incomplete bars, swing confirmation, and profile levels that develop over time.
Confirm that the required data or calculation is available to the script. A visible chart feature does not automatically mean a strategy can access an identical series. Keep any approximation explicit and verify that it still answers the intended question.
Use native strategy properties and results to include commission and slippage, inspect trades, and compare net performance and drawdown. Hold the other rules constant when testing the extra volume condition, and reserve later data for validation. Repeatedly adjusting a threshold to fit past examples can overstate its usefulness.
Use Momentum Tools as Additional Context
Momentum and money-flow tools from the Library can add context to a price setup on a Quant Chart, but they are not direct measurements of institutional inventory or literal capital entering and leaving the market.
Define which condition you want to test rather than assuming that several colored states provide independent confirmation. A signal or alert is also distinct from a broker-executed order.
Video: A Beginner’s Guide to Volume-Price Analysis
This TC Trading tutorial introduces volume-price analysis. Use its examples for learning, then apply explicit definitions and risk rules when testing your own setup.
Compare the Methods Without Double-Counting Evidence
Spikes describe unusual activity, profiles locate historical activity, and divergences compare the relationship between price and an activity measure. They answer different questions, but can still draw on the same underlying data.
- For breakouts: distinguish the activity spike from the price condition that confirms the entry rule.
- For ranges: use profile boundaries as reference zones and define a failed-range condition.
- For possible reversals: require the chosen price trigger rather than acting on divergence alone.
- For every method: check volume units, venue, session, missing data, and the information available at the decision time.
Keep a record of rejected setups and failed trades as well as successful examples. The goal is to learn whether a method changes the strategy’s results, not to explain every historical move after it happens. For related approaches, see OBV, VPT, and CMF compared and volume and breakout confirmation.
FAQs
How does volume analysis help spot potential trend reversals in trading?
It can highlight unusual activity or a mismatch between price and a volume measure. These observations are reasons to investigate a setup, not reliable reversal timing by themselves. Define the price trigger, invalidation, and risk before acting.
How does volume profile help identify key support and resistance levels?
It maps historical activity across price bins, including high-volume nodes, the Point of Control, and value-area boundaries. Use them as reference zones for a defined price reaction; they do not guarantee a bounce, breakout, or return to the POC.
Why should traders analyze volume divergence across multiple timeframes?
Different timeframes can put a signal in broader context, but their data overlaps and combining them does not guarantee higher accuracy. Compare corresponding swings, keep the indicator definition consistent, and respect the time required to confirm each signal.
Read next