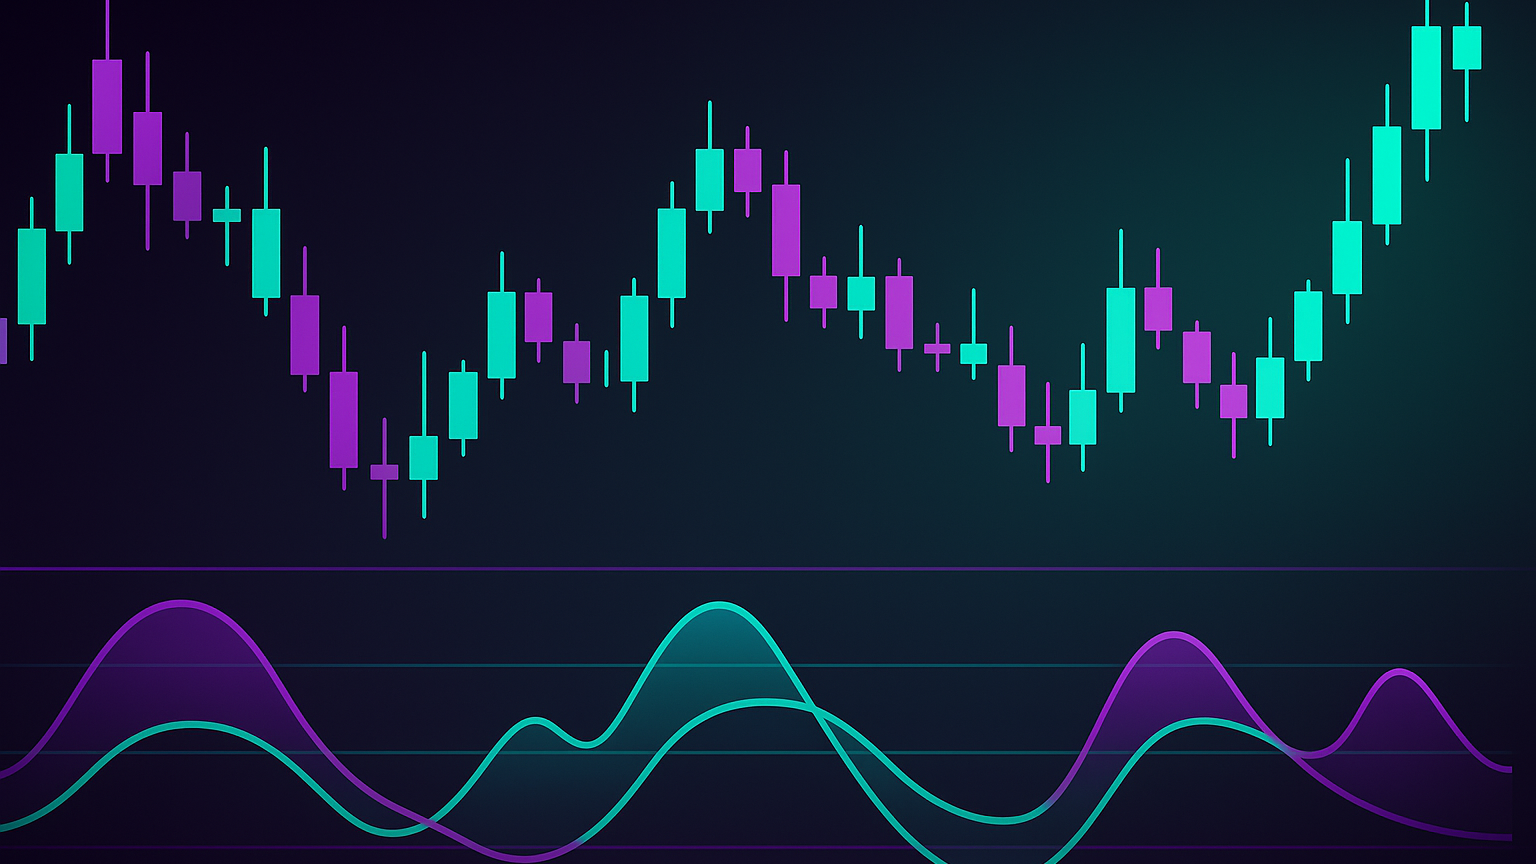
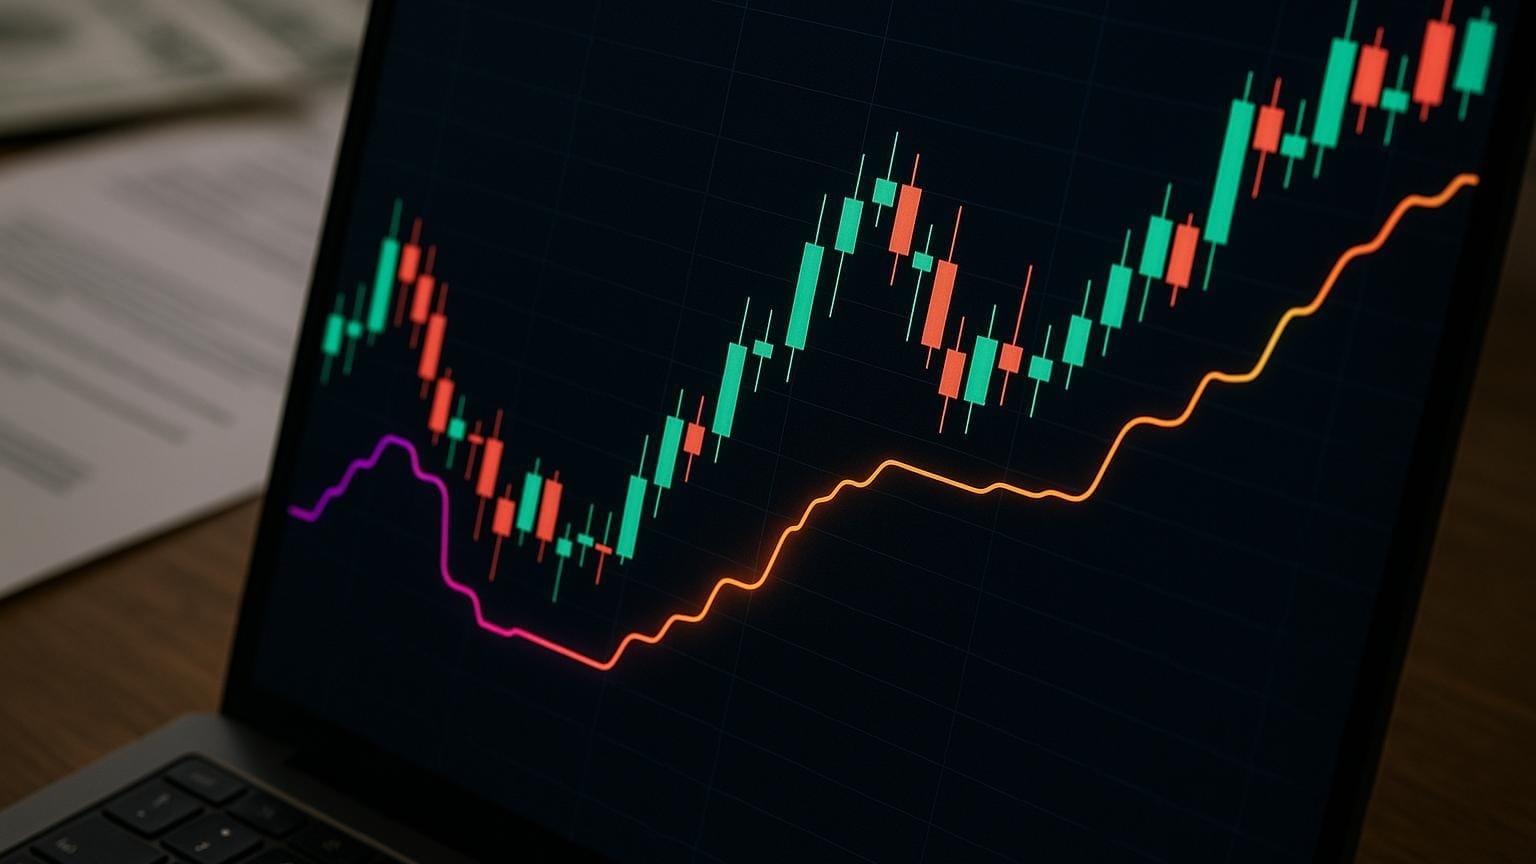
Learn how to use candlestick patterns to predict price movements in trading, improve accuracy, and manage risks effectively.
Candlestick patterns help traders predict price movements by analyzing market trends and sentiment. Here's a quick overview of what you'll learn:
- What Are Candlestick Charts?: Visual tools showing open, high, low, and close prices for a specific period.
- Main Candlestick Patterns:
- Bullish Patterns (e.g., Hammer, Bullish Engulfing) signal potential price increases.
- Bearish Patterns (e.g., Bearish Engulfing) indicate possible price drops.
- Neutral Patterns (e.g., Doji) show market indecision.
- How to Use Them:
- Combine patterns with indicators like RSI or moving averages for better accuracy.
- Confirm patterns with volume data.
- Use stop-loss orders to manage risk.
- Tools for Pattern Detection: Platforms like TrendSpider and TradingView simplify pattern spotting.
Quick Tip: Always validate patterns with the broader market trend and practice in a demo account before trading real money.
The ONLY Candlestick Pattern Guide You'll EVER NEED
Main Candlestick Pattern Types
Candlestick charts provide valuable insights into market trends. Let's break down the main candlestick patterns and what they indicate.
Upward Price Patterns
Bullish patterns often appear at the end of a downtrend, signaling a potential price reversal. For example, Boeing Company’s (#BA) weekly chart showed Hammer patterns before jumping from $67.50 to $141.20.
| Pattern Type | Key Characteristics | When to Look For It |
|---|---|---|
| Hammer | Long lower shadow with a small body near the top | At the end of a downtrend |
| Bullish Engulfing | Second candle fully engulfs the previous one | Following a steady downtrend |
| Morning Star | Three candles: a small-bodied middle candle with gaps on either side | At the bottom of a downtrend |
Downward Price Patterns
Bearish patterns often signal the end of an uptrend and the start of a decline. For example, Reliance Industries saw a Bearish Engulfing pattern lead to a sharp drop. For managing risk, consider placing stop-loss orders 5 pips above the pattern’s high and aim for a 2:1 reward-to-risk ratio.
Sideways Price Patterns
Neutral patterns like Doji and Spinning Tops indicate indecision. A Doji forms when open and close prices are nearly identical (body ≤5% of total range). Spinning Tops show small bodies with long shadows. Wait for the next candle to confirm.
Pattern Recognition Methods
Manual Pattern Spotting
- Understand the trend: Up, down, or sideways.
- Spot formations: Hammers, engulfings, dojis.
- Check volume: Confirms strength.
- Identify support & resistance levels: Patterns near key price levels matter most.
- Confirm: Wait for the next candle.
Pattern Detection Software
Automated platforms like TrendSpider (4.8/5) scan 150+ patterns and offer multi-timeframe analysis for efficient market scans.
Conclusion
Candlestick patterns offer a clear window into market sentiment. When combined with indicators and volume, they form a robust framework for trade entries and exits. Start with demo trading, use reliable pattern tools to spot setups, and verify your approach with backtesting before going live.


