Trading Indicators with ChatGPT (Step-by-Step Guide)
Use ChatGPT to turn an indicator idea into a clear specification, then verify the generated code in the charting environment where you intend to use it. A script that compiles is only the first checkpoint. Its calculations, visuals, timing and alert behavior must also match the brief.
This guide builds a percent-change anomaly study step by step. LuxAlgo’s native charts and Quant provide a chart-based development path; a separate TradingView workflow uses its Pine Editor. Keep the target environment explicit rather than assuming every generated script behaves identically in both.
1. Choose the Chart and Define the Study
On LuxAlgo’s native charts, select the instrument and timeframe before iterating. Ask Quant, our coding agent for the indicator you want, including whether it belongs in a separate pane or over price candles. Open Code to inspect the result, then use Run after signing in. Review the output before requesting another change.
If you start in ChatGPT, give it the same specification and state the intended platform. Ask it to identify assumptions and explain the calculation. Transfer the result to the appropriate editor and verify it there. A text answer is not evidence that the script compiled, plotted correctly or passed a historical test.
| Decision | Example for this tutorial |
|---|---|
| Purpose | Identify unusually large close-to-close percentage changes |
| Display | A separate pane with a zero reference and mean-centered deviation bands |
| Lookback | 20 completed percentage changes preceding the current bar |
| Calculation | Population standard deviation of those preceding values |
| Signal timing | Flag an anomaly only when the current candle closes |
| Scope | One symbol and the chart timeframe; no external data requests |
The lookback and threshold are educational choices, not optimized trading parameters. Write them down before assessing the chart. Otherwise, it is easy to keep changing the settings until the historical picture looks convincing.
2. Use the Appropriate Language Version
For a new TradingView script, the current Pine Script documentation is version 6. State the version in the request. If you maintain existing v5 code, use the official migration guide and verify behavior after conversion. There is no need to present starting in v5 as a universal best practice.
The editor’s converter requires the v5 script to compile first, and some converted scripts need manual fixes. Version 6 changes include dynamic requests by default and other language behavior. Our single-symbol example does not need an external data request, so adding one would introduce unnecessary complexity.
For native LuxAlgo development, follow the supported workflow and check the actual result in LuxAlgo. Avoid assuming that an example from another runtime has identical support. Report the exact error and intended behavior if it does not run as expected.
3. Specify the Percent-Change Calculation
Let Ct be the current close and Ct−1 the previous close. Define the percentage change as rt = 100 × (Ct / Ct−1 − 1). If either value is missing or the previous close is zero, the result should be unavailable rather than a fabricated zero.
For a move from 100 to 101, r is +1%. From 100 to 99, it is −1%. From 101 to 100, it is approximately −0.9901%, not −1%. These simple checks help detect accidental use of absolute price change or the wrong denominator.
For the baseline, use the preceding N completed returns: rt−1 through rt−N. Their average is μ, and their population standard deviation is σ = √[Σ(r−μ)² / N]. Excluding the current return prevents the event being measured from changing its own reference band.
Plot bands at μ ± σ, μ ± 2σ and μ ± 3σ. Keep zero as a separate reference line. Bands centered on zero describe a different calculation from bands centered on the rolling mean. Do not switch between them without changing the specification.
Mark a completed-bar anomaly when |rt − μ| > 2σ, provided the entire baseline is available and σ > 0. Suppress the anomaly marker during warm-up or when the baseline has no variation. This is a design choice for the tutorial; another treatment of zero variation would need to be defined explicitly.
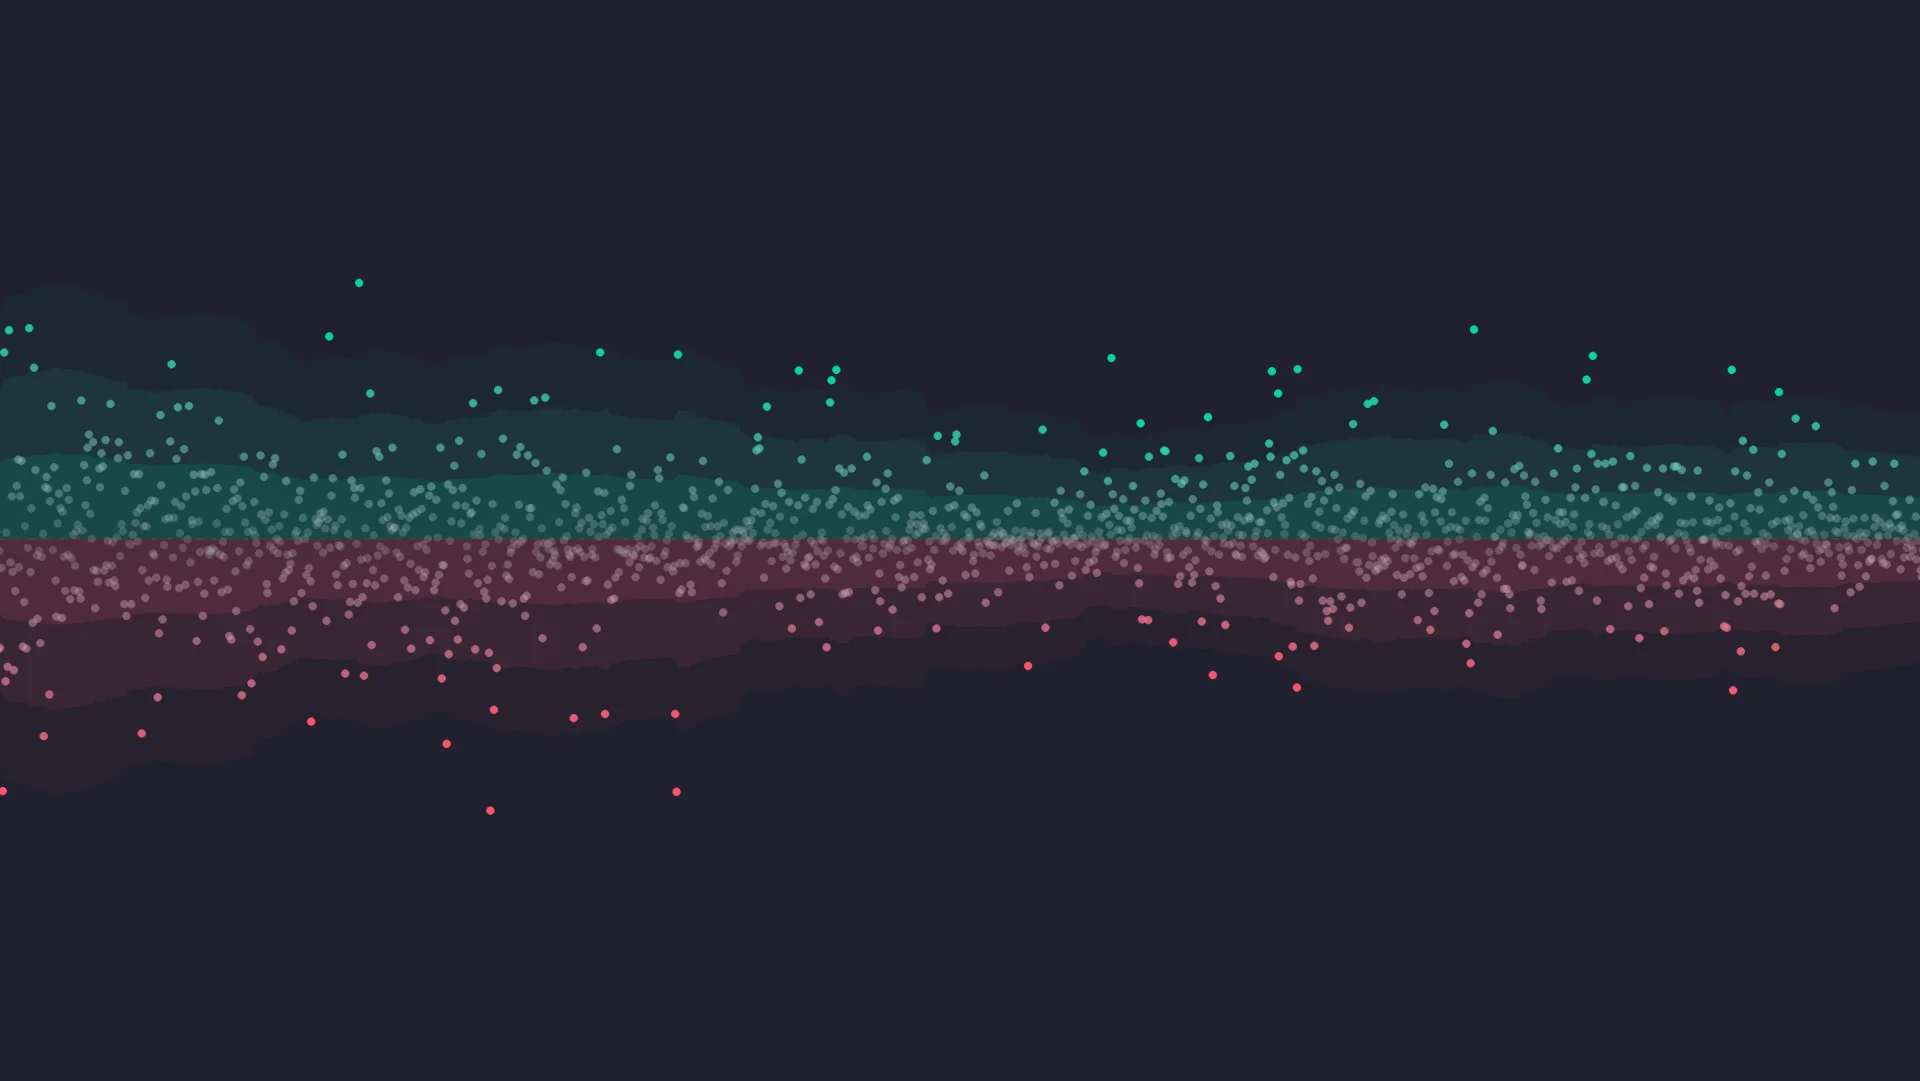
A large deviation is not automatically a reversal, exhaustion point or trade entry. Returns do not have to follow a normal distribution, so a two-standard-deviation threshold is not a guaranteed probability statement. Treat the marker as an event to investigate.
4. Give ChatGPT or Quant a Reviewable Prompt
Start by requesting the base percentage-change plot, then add the baseline and bands, and finally add the closed-bar marker. Keeping each change small makes it easier to see when a calculation or visual rule stops matching the brief.
Example specification: “Create an indicator in a separate pane for the selected chart. Calculate close-to-close percentage change as 100 × (close / previous close − 1). Plot positive values green and negative values red. Add a zero line. Using an adjustable lookback of 20 preceding completed returns, calculate their mean and population standard deviation, excluding the current return. Plot mean-centered bands at one, two and three standard deviations. Mark a two-standard-deviation exceedance only at the current candle’s close, after warm-up and when deviation is positive. Do not request another symbol or timeframe, use future data, shift markers into the past or place trades. Explain the indexing and missing-data handling.”
When requesting TradingView code, add “Pine Script v6” to that brief. Review whether the output actually uses the preceding window, checks for missing values and implements the requested timing. A model’s explanation can be wrong even when it sounds precise.
5. Check the Numbers Before the Styling
Use a small known sequence to test the math independently. For a four-value baseline of −1%, 0%, +1% and +2%, the mean is 0.5 percentage points. The population variance is 1.25, so σ is approximately 1.118 percentage points. The two-deviation bands are about −1.736% and +2.736%. A current return of +3% exceeds the upper band under this example.
The four-value case is a compact calculation check; the default tutorial lookback remains 20. Verify the same definitions in the generated implementation. Check the first available value, the first complete baseline, a flat-price segment and a gap. Then inspect a second instrument and timeframe to identify assumptions tied to one chart.
Use a separate pane for this study so percentage changes are not confused with the price scale. TradingView’s force_overlay explanation describes selective price-chart visuals from pane scripts, but that extra behavior is unnecessary for the base example.
6. Debug Errors Without Changing the Goal
If compilation fails, preserve the current code and provide the exact error message, line and target environment. Ask for a focused correction that keeps the formula and signal timing intact. After the repair, repeat the numerical checks rather than accepting compilation as proof of correctness.
A runtime failure is different from a compiler error. A script may compile but fail on historical or new bars, or it may run without showing a plot because its condition never occurs. LuxAlgo’s indicator documentation describes Fix with Quant for sending an error back for repair. You still need to review the resulting behavior.
For a visual defect, describe what you expected and what appeared, and include the relevant chart context. Request one change at a time. Keep a working version so a styling adjustment does not silently alter the calculation.
7. Check Repainting and Alert Timing
TradingView’s repainting guide distinguishes historical and real-time behavior. On an open bar, prices can change before the close. That normal behavior is different from leaking future information into a historical test or drawing a confirmed event at an earlier time.
For this study, the live percentage-change plot may move while the candle is open, but the anomaly marker should wait for confirmation. Verify that any configured alert follows the same rule. A closed-bar condition addresses this specific timing choice; it does not solve every possible source of repainting, data revision or multi-timeframe mismatch.
Reload the chart and compare completed markers with the observations you recorded in real time or an appropriate test. Confirm that no marker was moved into the past. Adding market-structure context or another indicator cannot repair incorrect timing inside the script.
8. Turn the Indicator into a Strategy Only After Defining Rules
An indicator displays information. A strategy also defines entries, exits, position size and order behavior. “Buy every anomaly” is an additional trading hypothesis, not something established by the visualization. Specify direction, holding period, stop logic and risk before requesting a strategy conversion.
Use Quant’s strategy workflow to develop the rules, inspect the code and run it yourself. For TradingView, review its strategy documentation to understand simulated orders and fills. Keep the test tied to the actual execution environment.
Use native strategy testing with standard candles, realistic commission and slippage, and a separate testing period. Check data coverage. Review drawdowns, trade counts and sensitivity to assumptions as well as net returns; a short profitable sample is not proof of a reliable edge.
Use the native LuxAlgo journal to review supported trade records and compare actual decisions with the tested rules. Record changes to inputs and logic so results from different versions are not mixed together.
Other LuxAlgo Tools and Plan Access
Quant can turn a generated indicator into a strategy and backtest it against years of history. That is a separate step from generating the indicator, not automatic validation of arbitrary custom code.
Use the LuxAlgo Library for study ideas and compare current plans and access for the tools and credits you need. Distinguish annual billing equivalents from month-to-month charges, and verify market-data access separately. More credits or more indicators do not establish a better strategy.
Frequently Asked Questions
Can ChatGPT produce a finished trading indicator without testing?
It can help draft a specification and code, but the result must be checked in the target charting environment. Compilation, calculation accuracy, visuals and signal timing are separate checks.
Should new TradingView examples use Pine Script v5 or v6?
The current documentation is version 6. Use the intended version explicitly, and follow the migration guide when maintaining older code. Verify behavior after conversion rather than assuming compilation preserves every result.
Does a two-standard-deviation move predict a reversal?
No. It identifies a large deviation under the chosen calculation. It is not a guaranteed probability, reversal signal or profitable entry rule.
Does waiting for candle close eliminate all repainting?
No. It can address signals that fluctuate on the current open bar, but future-data leakage, retrospective plotting, other timeframes and data revisions require separate review.
Read next