Bollinger Bands and MACD: Entry Rules Explained
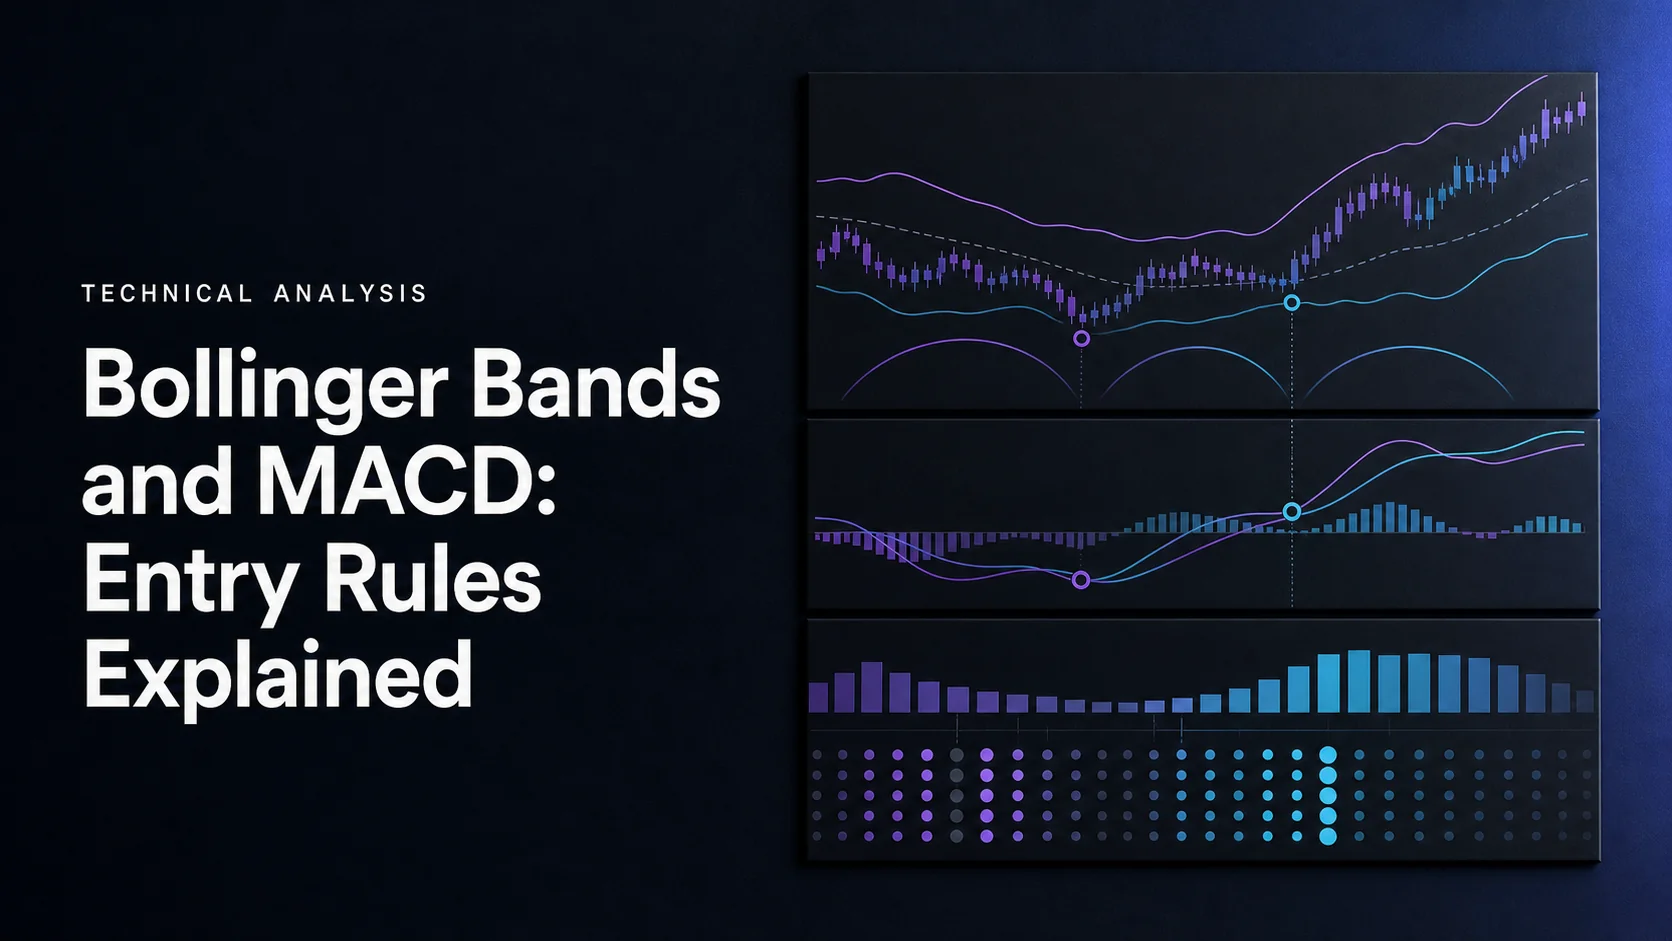
Combine Bollinger Bands and MACD by assigning each a clear job: the bands describe relative price location and volatility, while MACD describes the relationship between moving averages. Choose whether you are testing a reversal or a continuation entry before interpreting the signals. The same close outside a band can support a breakout hypothesis and contradict a reversal hypothesis.
Start with native LuxAlgo charts to inspect the setup, then use Quant, our coding agent, to express complete strategy rules. Review the generated code and run it manually. Agreement between two price-derived indicators is a condition to evaluate, not proof of an edge.
What the Two Indicators Measure
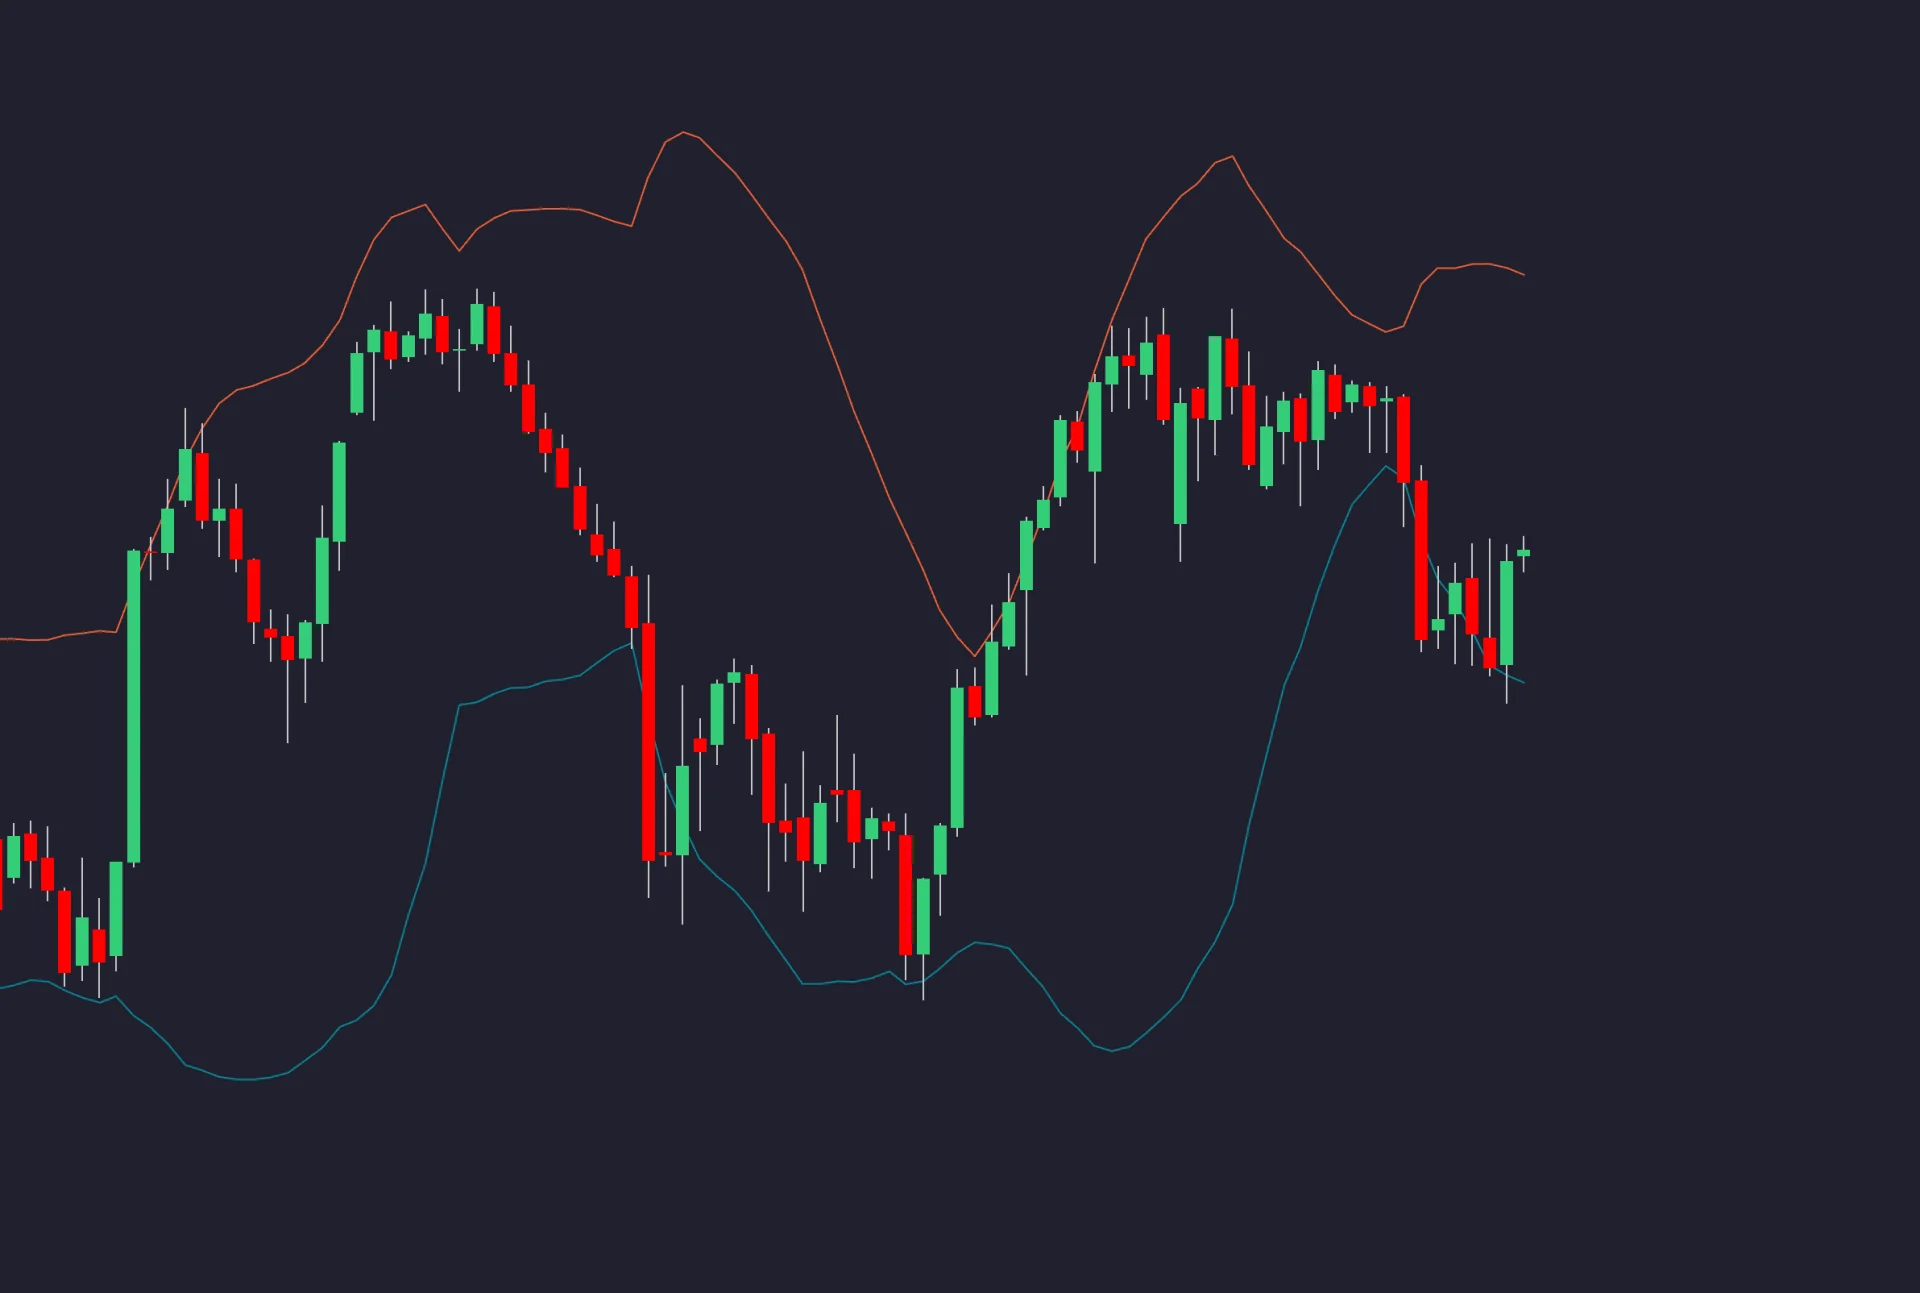
Classic Bollinger Bands use a 20-period simple moving average with bands two standard deviations above and below it. The lookback, source price, deviation multiplier and calculation method must be specified. John Bollinger’s original rules emphasize that band tags alone are not buy or sell signals, price can walk a band during a trend, and closes outside the bands initially suggest continuation rather than reversal.
The defaults are starting points. Increasing the multiplier from 2 to 2.5 widens the envelope for the same inputs, but does not establish that remaining trades will be more accurate. Do not assume that two standard deviations guarantee 95% of market prices will stay inside the bands.
For the conventional EMA-based MACD with settings 12, 26 and 9: MACD = EMA(12) − EMA(26); signal = EMA(9) of MACD; histogram = MACD − signal. TradingView’s MACD documentation also exposes averaging-type choices. Record those choices rather than assuming every implementation uses identical smoothing.
| Observation | Exact meaning | Interpretation limit |
|---|---|---|
| MACD crosses above its signal | Previous MACD ≤ signal; current MACD > signal | The histogram crosses above zero at the same event; these are not two independent confirmations. |
| MACD crosses above zero | The fast average moves above the slow average | This is different from crossing the signal; it may occur on a different bar. |
| Positive histogram increases | MACD minus signal is positive and larger than before | It measures separation of those series, not a guaranteed price advance. |
| Price touches the lower band | The chosen price reaches or falls below the lower envelope | A touch alone does not establish that a decline has ended. |
For example, MACD moving from −0.4 to −0.2 while its signal moves from −0.3 to −0.25 changes the histogram from −0.1 to +0.05. That is a bullish signal crossover while MACD remains below zero. Requiring a MACD zero crossover as well would define a different, potentially much later entry.
Define Reversal and Breakout Entries Separately
The following rules are illustrative hypotheses, not recommended settings or verified profitable systems. Evaluate completed candles, define one position at a time unless otherwise specified, and place the simulated entry at the next eligible price after the condition becomes known. Do not assume a fill at the already completed signal candle’s close.
Long Reversal after a Lower-Band Excursion
- Use a predefined range or reversal context, such as a separately tested trend filter; do not identify a range only after seeing it reverse.
- Require the completed candle’s low to touch or pass its lower band and its close to finish back above that band. Specify whether the band value is calculated on the completed candle or frozen from the preceding candle.
- For one strict variant, require MACD to cross above its signal on that same completed candle. A crossover within the next three bars is a separate variant requiring an expiry rule and a price condition that must still hold.
- Enter at the next eligible price, with the stop and exit logic determined before sizing. Cancel if the expected entry no longer satisfies the planned exposure or reward conditions.
Short Reversal after an Upper-Band Excursion
Mirror the rule: the completed high reaches or exceeds the upper band, the close returns below it, and MACD crosses below its signal under the specified timing rule. A strong trend can keep reaching the upper band; neither a touch nor a crossover guarantees a reversal. Short-selling availability, costs and instrument restrictions belong in the test.
Continuation Breakout
A separate long breakout variant requires a completed close above the upper band, increasing normalized BandWidth, and MACD above its signal. A short variant uses a close below the lower band and MACD below its signal. Being above or below the signal is a state; requiring a fresh crossover on that candle is a stricter alternative. Choose one explicitly.
Normalized BandWidth is (upper band − lower band) ÷ middle band, assuming a positive, nonzero middle value; multiply by 100 for percent. Bands at 102 and 98 with a middle of 100 give 4%. Compare the same definition across bars. A rising raw width can mean something different when price levels change.
If adding volume, define the threshold and reference window. For example, completed-bar volume greater than 1.5 times the mean of the preceding 20 completed bars excludes the signal bar from its reference mean. Volume of 180 against a prior mean of 100 passes that rule. Exchange volume and tick activity are different inputs; a volume filter does not guarantee a successful breakout.
| Setup | Condition to test | Failure or exit question |
|---|---|---|
| Lower-band reversal | Excursion, close back inside, specified bullish MACD event | Does price breach the fixed setup low, or fail to reach the chosen target in time? |
| Upper-band reversal | Excursion, close back inside, specified bearish MACD event | Does price breach the fixed setup high, or exceed the permitted holding period? |
| Upward breakout | Close outside upper band, defined expansion and bullish MACD state | Does a later completed close back inside invalidate the breakout, or does a separate stop govern it? |
| Downward breakout | Close outside lower band, defined expansion and bearish MACD state | Which stop, target and return-inside rule applies, and in what order? |
Advanced Entry Methods
Divergence Requires Matched Price and Indicator Points
Regular bullish divergence compares a lower price low with a higher indicator value at the matched observations. Regular bearish divergence compares a higher price high with a lower indicator value. Simply finding rising MACD lows near the lower band omits the required price comparison.
Specify whether the series is MACD itself or its histogram, how swing points are selected, and whether the indicator is sampled at the price pivots or matched by another rule. Do not switch series or choose favorable points after seeing the outcome. If identifying a pivot requires two later bars, the divergence becomes available after those bars complete, not at the earlier pivot.
Divergence can persist while price continues trending. Define a subsequent executable trigger, such as the completed return-inside and crossover rule, together with an expiry. A universal success rate or reward-to-risk ratio cannot be assigned to divergence without the full rules, sample and costs.
A Squeeze Describes Compression, Not Direction
Define compression using a fixed rule, such as completed BandWidth being below a chosen percentile of the preceding 120 completed BandWidth observations. Specify the percentile and calculation method before testing. A squeeze is not necessarily a MACD value near zero, and compression alone does not identify the direction or timing of the next move.
After compression, use the chosen breakout rule and define how long the squeeze condition remains eligible. Requiring MACD to cross both zero and its signal on the breakout candle can exclude many events because those crossings describe different relationships. Money-flow or other oscillator filters are additional hypotheses, not reliable advance knowledge of a strong breakout.
Use Only Available Higher-Timeframe Values
A four-hour or daily chart can supply context while a 15-minute or one-hour chart supplies the entry event. Define context explicitly—for example, a completed higher-timeframe close above its middle band with that average above its preceding completed value. This is an illustrative trend condition, not something band width alone establishes.
Use the last completed higher-timeframe value available at the entry decision. The eventual daily close cannot guide a morning entry. Specify timezone and session boundaries, and verify alignment in the implementation. Adding timeframes does not by itself establish a percentage improvement in timing or automatically synchronize executable signals.
Calculate Size from the Actual Stop
Position size depends on the distance from the expected entry to the planned stop. Multiplying BandWidth by ATR does not identify that distance. Raw band width and ATR both have price units; multiplying them produces squared price units. Normalized BandWidth times ATR has price units, but it is still not the strategy’s stop distance unless the stop rule explicitly defines it that way.
For a cash instrument worth $1 per price point per unit: quantity = floor((cash risk budget − estimated total costs) ÷ absolute entry-to-stop distance). For a contract, include its monetary point value, currency conversion and permitted size increment. Check notional exposure and available buying power separately. If costs depend on quantity, include that relationship rather than treating costs as a fixed allowance.
Example: a $10,000 account with an illustrative 2% risk budget allows $200. With a $100 expected entry, a $98 stop and a $20 estimated total cost allowance, quantity = floor(($200 − $20) ÷ $2) = 90 units. Notional exposure is $9,000. A fill at $97 after a gap would lose $270 before costs, so the planned risk budget is not a guaranteed maximum loss.
Place the stop according to the setup being tested. A reversal might use the setup extreme plus a predefined ATR buffer; a breakout might use its own structural or volatility rule. Specify ATR length, multiplier and whether the value is frozen at entry. An opposite-band stop or a one-to-two-ATR buffer is a candidate rule, not universally appropriate. Never silently widen the stop as the bands expand.
Define Targets, Partial Exits and Timing
A reversal strategy can test a middle-band or opposite-band target, while a breakout strategy may test fixed multiples of initial risk or a trailing exit. Specify whether a band target is frozen at entry or updated on completed bars. A rule that exits on an outside-band close would conflict with an entry that requires that same outside-band close unless its timing is clearly separated.
Closing 50% of the position is different from taking “50% profit.” If half exits at +1R and half at +3R, the combined gross result is +2R, assuming both fills. If the second half instead exits at −1R, the combined gross result is 0R before costs. Here R is the initial planned stop risk, with equal unit weights and no resizing. Gaps and partial fills can change the result.
Define what happens when a stop and target are both inside one historical candle. Do not automatically assume the favorable order. Include spread, commissions, slippage and financing where applicable, and compare results across periods rather than selecting a single attractive example.
Build and Review the Rules in Native LuxAlgo
Open native LuxAlgo charts and use the Indicators picker to inspect the relevant calculations and inputs. Keep the symbol, timeframe, source price and session consistent when comparing a reversal with a breakout rule.
Ask Quant, our coding agent to implement one hypothesis at a time. For example: “Create a lower-band reversal strategy with a completed close back inside, a same-bar MACD signal crossover, next-eligible-price entry, a fixed setup-low stop with an exposed buffer, and explicit costs. Prevent future-data use.” Inspect the generated code, then run it manually. Check individual trades before interpreting aggregate performance.
After review, change exposed numerical values through Inputs and simulation assumptions through Properties. Use Quant again when changing logic. The native strategy viewer supports reviewing the result; repeated input comparisons still require a separate later evaluation sample that did not select the settings.
Library trend and momentum tools can add context on a Quant Chart, but an extra filter does not validate this combination on its own, and an alert is not a trade execution. Add a filter only after defining and testing its incremental role.
Video: A MACD and Bollinger Bands Swing Example
Trading Strategy’s 2-minute, 52-second tutorial, “AWESOME Swing Trading Strategy With MACD and Bollinger Bands,” adds a weighted moving average as a third indicator. It illustrates another rule set rather than demonstrating every reversal, squeeze and breakout variant above. Evaluate its conditions and execution assumptions independently.
Frequently Asked Questions
Is a lower Bollinger Band touch a buy signal?
No. Price can continue along a band during a trend. A reversal strategy needs defined context, a subsequent trigger, an executable entry and risk controls; a touch alone does not establish a reversal.
Does a MACD signal crossover also need a histogram zero crossover?
For a standard histogram equal to MACD minus signal, those describe the same crossing event. Requiring both does not provide independent confirmation. A MACD-line zero crossover is a different event.
Does a Bollinger Band squeeze predict direction?
No. It describes compression under the chosen BandWidth definition. Specify a later directional trigger, an eligibility window and failure rules instead of inferring direction from narrow bands alone.
Can I size a position using BandWidth multiplied by ATR?
Use the actual expected entry-to-stop distance and the instrument’s monetary point value. BandWidth multiplied by ATR does not identify that distance unless an explicit stop rule defines it. Include costs, size increments and exposure limits.
How should I combine multiple timeframes?
Assign the higher timeframe a specific context condition and the lower timeframe an entry rule. Use only higher-timeframe information available at the decision time, with explicit session boundaries and completed-bar handling.
How do I test this combination in LuxAlgo?
Inspect the indicators in native LuxAlgo charts, ask Quant, our coding agent, for complete strategy logic, review the generated code and run it manually. Check individual trades, costs and timing, then evaluate frozen rules on later data.
Read next