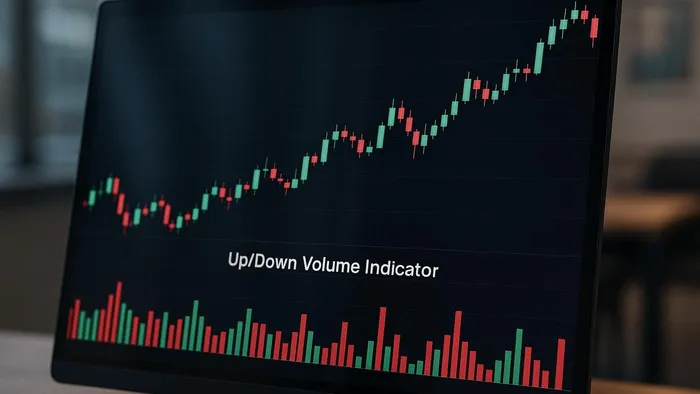

Explore the Up/Down Volume Indicator to analyze market momentum and improve trading strategies through effective volume analysis.
The Up/Down Volume Indicator (UDVR) is a technical analysis tool that helps traders understand market momentum by comparing trading volume on "up days" (when prices rise) versus "down days" (when prices fall). A ratio above 1.0 signals bullish sentiment, while a ratio below 1.0 indicates bearish momentum. Traders use this indicator to confirm trends, spot potential reversals, and gauge buying or selling pressure across different timeframes and assets like stocks, cryptocurrencies, or ETFs.
Key Points:
- How It Works: Calculates the ratio of "up volume" to "down volume" over a set period.
- Interpreting Results: A higher ratio (>1.0) suggests buyers dominate, while a lower ratio (<1.0) signals selling pressure.
- Applications: Useful for trend confirmation, spotting divergences, and timing trades.
- Flexibility: Works across various markets and timeframes, from daily to intraday.
The indicator becomes even more effective when combined with other tools like trendlines, moving averages, or advanced platforms like LuxAlgo, which provides enhanced volume analysis and AI-driven backtesting for strategy optimization.
Indicators on TradingView | Up/Down Volume Ratio Indicator Testing
How the Up/Down Volume Indicator Works
The Up/Down Volume Indicator measures and compares trading volume based on price direction, offering insights into market sentiment and momentum changes. Here's a closer look at how it works and how traders can use it effectively.
Step-by-Step Calculation
To calculate the indicator, start by gathering volume data for each period. Use Up Volume (UV) when the price closes higher than the previous close, and Down Volume (DV) when it closes lower.
- A higher close reflects buying pressure.
- A lower close indicates selling pressure [1].
Next, sum the up and down volumes over your chosen time period and divide the total up volume by the total down volume. For instance, if a stock accumulates 2.5 million shares of up volume and 1.8 million shares of down volume over 10 days, the ratio would be about 1.39. This suggests a bullish sentiment, as buyers outpaced sellers during that period.
Interpreting the Indicator's Movement
The ratio's movement provides a snapshot of momentum strength. A value above 1.0 signals bullish sentiment, with higher values indicating stronger buying activity. For example, a ratio of 1.5 shows that buyers generated 50% more volume than sellers. Sudden and sharp deviations from 1.0 often point to rapid momentum changes, which could mark the start of a significant price move, either upward or downward.
Applying the Indicator Across Timeframes and Assets
The indicator's flexibility allows traders to adapt it to different timeframes and asset classes:

-
Timeframes:
- Daily traders often use multi-day periods to smooth out short-term noise.
- Weekly analyses provide a broader view of market trends.
- Intraday traders can apply it to hourly or 15-minute charts, though shorter timeframes require extra caution due to increased volatility.
-
Assets:
- Stocks: Works well with stocks, which typically have clear price movements and reliable volume data.
- Cryptocurrencies: Particularly effective with major pairs like Bitcoin and Ethereum, where volume data is readily available.
- Forex: Since traditional volume data is unavailable, traders might rely on tick volume or use the indicator with forex futures, where actual volume data exists.
- Indexes and ETFs: These instruments often exhibit smoother volume patterns, making them suitable for broader market trend analysis.
This versatility makes the Up/Down Volume Indicator a useful tool for traders navigating various markets and strategies. Whether you're analyzing stocks, crypto, or ETFs, this indicator can help identify shifts in buying or selling pressure, aiding in better-informed trading decisions.
Reading Volume Direction Changes
Grasping how to interpret shifts in the Up/Down Volume Indicator can help traders spot changes in market momentum and make better decisions. The key is in identifying patterns that reveal trend strength, weakness, or potential reversals.
Trend Confirmation and Reversal Signals
When the ratio moves in sync with price—rising during an uptrend or falling in a downtrend—it confirms the existing trend. On the flip side, if the ratio moves against the price trend (like a price drop paired with a spike in the ratio), it could signal a potential reversal.
Pay close attention to rapid changes in the ratio. For example, a sharp jump from 1.1 to 2.0 reflects intense buying activity, while a sudden drop from 1.3 to 0.6 highlights significant selling pressure. For more specific scenarios and interpretations, check out the table in the next section.
The size of the change is just as important as its direction. A gradual rise from 1.0 to 1.2 over ten days shows steady momentum, while the same increase over just two days suggests a sudden shift in market sentiment, often leading to more dramatic price moves.
Divergences also provide useful insights, often serving as early warnings of potential trend exhaustion.
Spotting Divergences
Divergences between price action and the Up/Down Volume ratio can act as early indicators of a trend losing steam. A bullish divergence happens when prices hit lower lows, but the ratio forms higher lows, signaling that selling pressure might be easing. A bearish divergence occurs when prices reach higher highs, but the ratio shows lower highs, hinting at reduced buying enthusiasm.
The length of a divergence adds to its reliability. Divergences lasting three to five periods are more meaningful than brief, single-period ones. Long-term divergences often point to major trend shifts. There are also hidden divergences to watch for—such as when prices make higher lows in an uptrend, but the ratio shows lower lows, suggesting the uptrend may be weakening. Similarly, in a downtrend, if prices form lower highs while the ratio makes higher highs, it could signal a reversal is on the horizon.
These divergence patterns often set the stage for specific trading opportunities, which are detailed in the next section.
Trading Scenarios and Signals
Different ratio patterns create distinct trading opportunities, allowing traders to approach decisions more systematically.
| Scenario | Ratio Range | Price Action | Market Implication | Trading Consideration |
|---|---|---|---|---|
| Strong Bullish | > 1.5 | Rising | Strong buying | Consider long positions, but stay alert for exhaustion |
| Moderate Bullish | 1.1 - 1.5 | Rising | Steady upward momentum | Likely trend continuation |
| Neutral/Consolidation | 0.9 - 1.1 | Sideways | Balanced buying/selling | Wait for clearer signals |
| Moderate Bearish | 0.6 - 0.9 | Falling | Increasing selling pressure | Consider short positions or exiting long positions |
| Strong Bearish | < 0.6 | Falling | Strong selling | Expect strong downward momentum |
| Bullish Divergence | Rising | Falling | Potential reversal building | Prepare for a possible trend change |
| Bearish Divergence | Falling | Rising | Trend exhaustion warning | Consider profit-taking or hedging |
Extreme ratio levels often signal turning points. Ratios above 2.0 or below 0.5 usually indicate overstretched conditions, where the current trend might pause or reverse. These readings are most effective when combined with other technical tools or fundamental market events.
Changes in the ratio also reveal shifts in sentiment. For instance, a move from 0.8 to 1.2 shows growing bullish momentum, while a drop from 1.4 to 1.1 suggests waning momentum, even if it remains above 1.0. Understanding these shifts can help traders time their entries and exits more effectively.
Finally, consistent signals across multiple timeframes—like daily, weekly, and monthly ratios all pointing in the same direction—can confirm robust trends. This alignment often leads to more reliable outcomes compared to mixed signals across timeframes.
Using the Indicator in Trading Strategies
The Up/Down Volume Indicator is most effective when used as part of a broader trading strategy, helping to confirm market conditions before making decisions.
Adding the Indicator to Your Strategy
This indicator shines as a supporting tool rather than the main driver of trade decisions. For instance, after spotting a trade opportunity through chart patterns, price action, or other analysis methods, you can use the volume ratio to confirm whether market conditions align with your expectations. Before entering a trade, look for the indicator to signal increasing buying pressure for long positions or rising selling pressure for short positions. If you’re already in a profitable trade, a shift in volume behavior might hint at fading momentum—an early warning to consider locking in profits. Additionally, the indicator can guide position sizing and help you identify false breakouts when price movements lack volume confirmation.
When paired with other technical tools, volume signals can make your trading approach even more precise.
Combining with Other Technical Tools
Integrating the indicator with other technical tools can add depth to your analysis. For example, moving averages can confirm the strength of a breakout if volume supports the move. Similarly, using volume data alongside support and resistance levels can provide stronger evidence of buying or selling interest at key price zones. Pairing volume signals with trendlines, oscillators, or Fibonacci retracements can further enhance your strategy. The idea is to ensure that all your tools work together, creating a well-rounded and reliable approach to trading.
Once you’ve built a robust strategy, it’s critical to manage risk effectively.
Risk Management Best Practices
Volume signals should always be paired with disciplined risk management to protect against sudden market reversals. Avoid relying solely on volume data; instead, combine it with price action and other technical factors for a more complete market view. Adjust your position sizes based on the clarity of volume signals, and always use stop-loss orders that reflect the conviction—or lack thereof—in the current market trend. If the expected volume confirmation doesn’t occur within a reasonable timeframe, consider scaling back or exiting the trade. Be aware of external factors, like reduced trading activity during holidays, which can impact the reliability of volume signals. Finally, track the outcomes of your trades to fine-tune your strategy and build confidence over time.
Using the Up/Down Volume Indicator with LuxAlgo Tools
LuxAlgo provides AI-driven workflows and specialized tools on TradingView, offering traders actionable insights directly on their charts. This builds on core concepts and provides a more dynamic way to interpret market activity.
Volume Analysis with LuxAlgo Library
With the LuxAlgo Library, traders gain access to a free collection of indicators compatible with platforms like TradingView and MetaTrader. These include a variety of volume-based tools that complement the Up/Down Volume Indicator, enhancing your overall analysis.
For those seeking advanced features, the Premium and Ultimate plans unlock exclusive toolkits tailored for in-depth technical analysis. These include:
- Price Action Concepts (PAC): Offers tools like volumetric order blocks and advanced market structure analysis.
- Signals & Overlays (S&O): Provides multiple signal algorithms and overlay visualizations to simplify volume pattern detection.
Additionally, LuxAlgo screeners allow users to quickly identify assets showing specific volume patterns across various tickers and timeframes, reducing manual chart analysis.
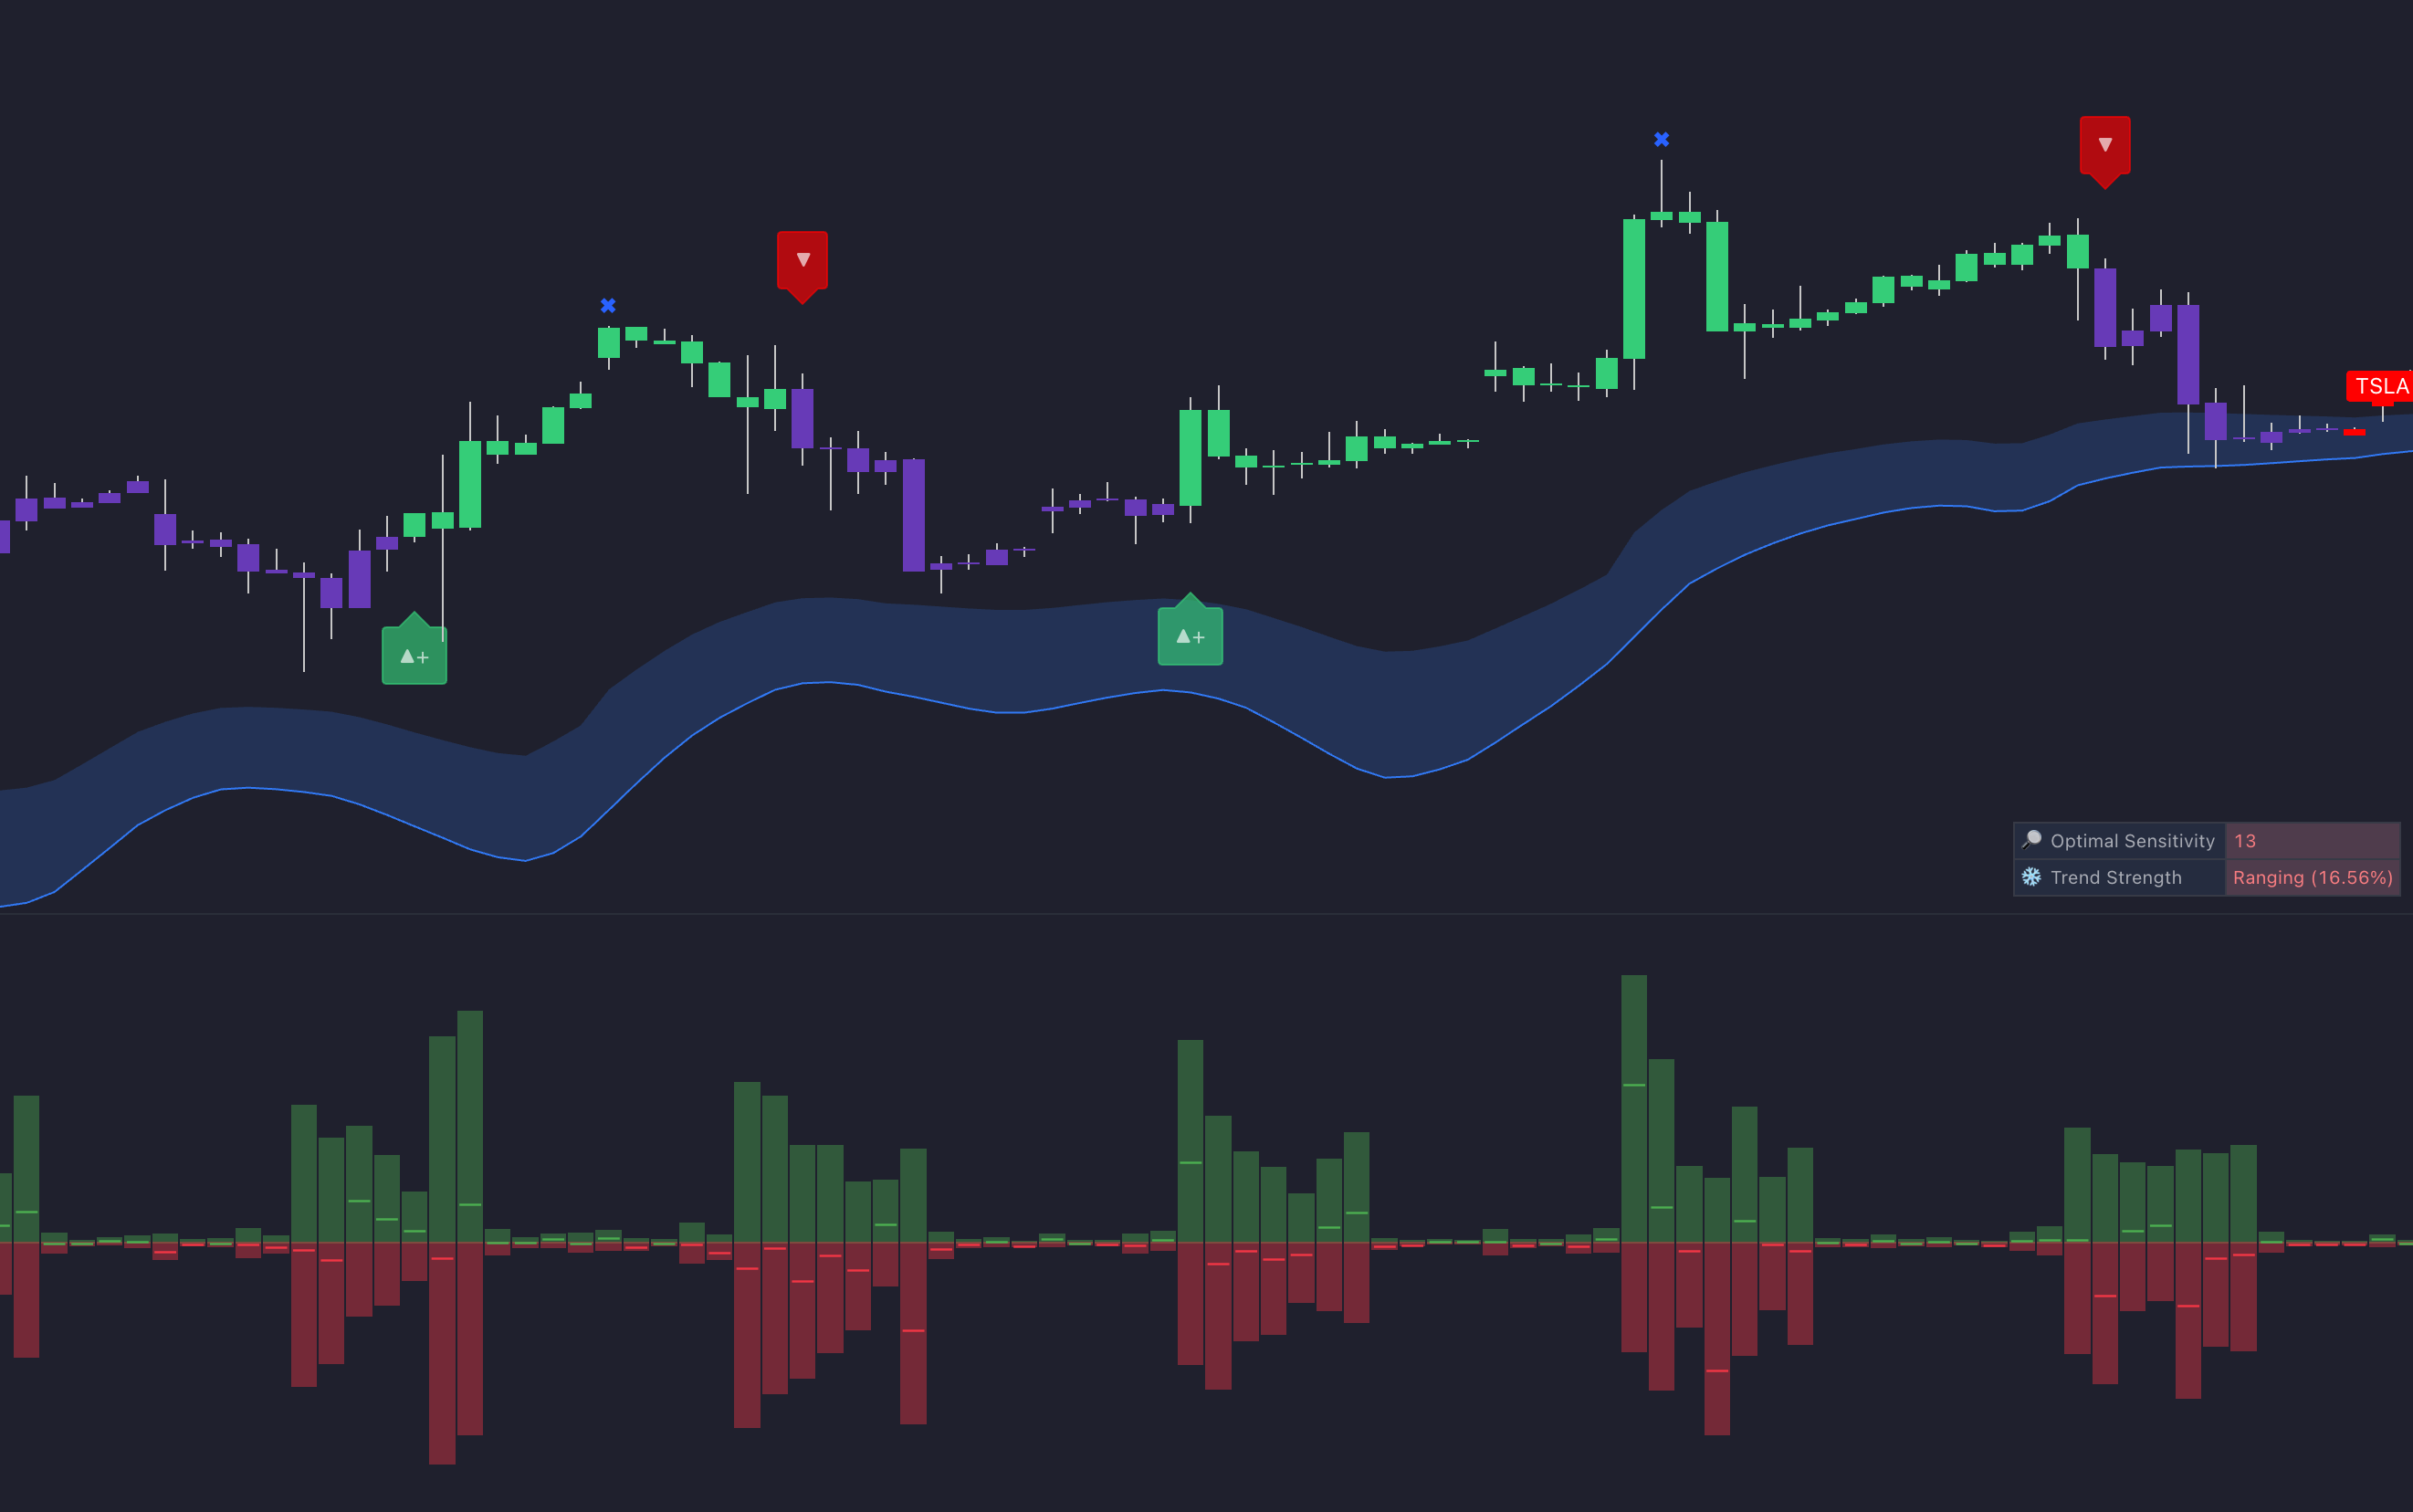
Working with Signals, Overlays, and Oscillator Matrix
Building on indicators from the Library, the platform includes toolkits that refine volume analysis with advanced visualizations and alerts. Among these, the Oscillator Matrix (OSC) is valuable for analyzing volume direction. This all-in-one indicator integrates components focused on volume and money flow, making it a strong partner for the Up/Down Volume Indicator.
The Money Flow components in the Oscillator Matrix offer visualizations of buying and selling liquidity entering the market. This provides an extra layer of confirmation for volume-based trading decisions. The Signals & Overlays toolkit further enhances this by delivering integrated alerts and intuitive visualizations, helping traders identify volume patterns at a glance.
A standout feature of the Oscillator Matrix is its ability to detect divergences, highlighting when price movements are not supported by corresponding volume changes. This is useful for spotting potential reversals or confirming ongoing trends based on volume behavior.
AI Backtesting and Strategy Optimization
LuxAlgo also provides tools for strategy optimization. The AI Backtesting Assistant evaluates volume-based strategies across multiple timeframes and asset classes. This web platform helps you create and test strategies rapidly, exploring thousands of parameter combinations.
For TradingView users, LuxAlgo also offers three integrated backtesters corresponding to PAC, S&O, and OSC toolkits—so you can test volume-based strategies directly on your charts. Together, these resources combine backtesting, real-time alerts, and AI-driven optimization with the Up/Down Volume Indicator.
Conclusion
The Up/Down Volume Indicator sheds light on market sentiment and momentum by focusing on the relationship between price and volume. By analyzing this interplay, traders can identify whether buying or selling pressure is genuinely driving market movements, offering a clearer picture of trading activity.
Tracking changes in volume direction provides insights that price action alone might miss. It helps confirm trends, signals potential reversals, and highlights divergences—making it a valuable component of any trading strategy. These principles form the foundation of the concepts explored in this guide.
LuxAlgo takes these fundamentals further by integrating advanced technology into volume analysis. Tools like the Oscillator Matrix provide additional insights into money flow, complementing traditional volume analysis techniques. Meanwhile, the AI Backtesting Assistant allows traders to test and fine-tune their volume-based strategies with precision. This blend of traditional analysis and modern tools equips traders with the resources needed to make confident, data-driven decisions.
FAQs
How can I use the Up/Down Volume Indicator alongside other tools to improve my trading strategy?
The Up/Down Volume Indicator becomes even more effective when paired with other technical analysis tools such as the Relative Strength Index (RSI), Moving Averages, or trend lines. These combinations can provide additional insights into market momentum, identify divergences, and enhance the reliability of trading signals.
Incorporating volume data alongside these tools allows traders to validate trends more effectively, recognize potential reversals, and refine their entry and exit strategies. This layered approach can help traders make more confident and well-informed decisions in the market.
What are the risks of relying only on the Up/Down Volume Indicator for trading decisions?
Relying only on the Up/Down Volume Indicator for trading decisions can be a risky move. In low-liquidity markets, where volume data tends to be less dependable, this indicator might produce misleading signals. This could lead to misjudging market trends or momentum, potentially steering traders in the wrong direction.
Another limitation is that volume indicators are lagging tools—they’re based on past data. Because of this, they might not always reflect what’s happening in the market at the moment. Relying too heavily on this indicator without factoring in other elements, like price action or the overall market environment, could lead to less-than-ideal trading choices. Instead, the Up/Down Volume Indicator works best when it's part of a broader, well-rounded trading strategy.
How does the Up/Down Volume Indicator work across different asset types like stocks, cryptocurrencies, and ETFs?
The Up/Down Volume Indicator is a handy tool for gauging market momentum across a range of assets, including stocks, cryptocurrencies, and ETFs.
When it comes to stocks, this indicator helps traders spot buying or selling pressure by analyzing changes in volume, offering a way to confirm market trends. In the world of cryptocurrencies, it tracks cumulative volume to highlight momentum shifts, which is particularly helpful in navigating these often volatile markets. For ETFs, the indicator uses volume data to shed light on market interest and liquidity, with higher trading volumes often pointing to stronger trends.
References
LuxAlgo Resources
- Volume Forecasting
- Reversal Spotting Made Easy
- SMT Divergences (LuxAlgo)
- LuxAlgo Home
- Volumetric Toolkit
- Market Sentiment Technicals
- Price Action Concepts
- Using Fibonacci Levels to Time Retracements
- Breakouts with Tests & Retests
- Support & Resistance (Dynamic)
- LuxAlgo Library
- Oscillator Matrix
- Money Flow Profile (LuxAlgo)
- AI Backtesting Assistant
- Volume Delta Methods Chart


