
Explore how the Williams %R indicator identifies market extremes and enhances trading strategies through momentum analysis.
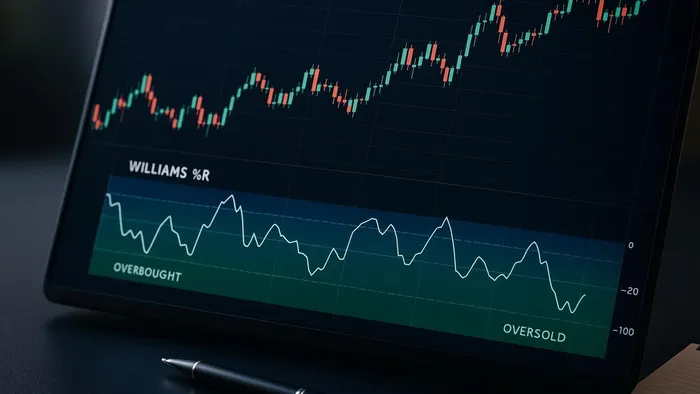
The Williams %R indicator is a simple yet effective way to identify overbought and oversold market conditions. Created by Larry Williams, it measures where the closing price sits within a specified range of highs and lows over a set period (typically 14 days). Its scale ranges from 0 to -100, with readings above -20 signaling overbought conditions and below -80 indicating oversold levels.
Key points to know:
- Formula:
%R = (Highest High – Current Close) / (Highest High – Lowest Low) × -100 - Overbought: Above -20, suggesting potential price pullbacks.
- Oversold: Below -80, hinting at possible price rebounds.
While useful for spotting momentum shifts, the Williams %R works best when combined with tools like moving averages, support/resistance levels, or volume analysis. Adjusting the look-back period can further refine its accuracy for different trading styles and market conditions. Always pair it with proper risk management to avoid false signals.
Williams %R Formula and Calculation
Williams %R Formula Breakdown
To effectively use the Williams %R indicator, it’s essential to understand the key components of its formula: the highest high, lowest low, and current closing price over a specified time frame. These elements allow traders to evaluate price momentum and identify potential market turning points.
Let’s break this down with an example using Apple Inc. (AAPL). Imagine calculating Williams %R for a 14-day period where:
- The highest high is $185.50
- The lowest low is $172.25
- Today’s closing price is $178.75
The formula for Williams %R is:
%R = (Highest High – Current Close) / (Highest High – Lowest Low) × -100
Now, plugging in the numbers:
- Highest High - Current Close = $185.50 - $178.75 = $6.75
- Highest High - Lowest Low = $185.50 - $172.25 = $13.25
- Williams %R = ($6.75 / $13.25) × -100 = -50.94
In this case, the result (-50.94) indicates that Apple’s price is right around the midpoint of its 14-day range. Each component has a role: the highest high reflects peak buying pressure, the lowest low highlights maximum selling pressure, and the current closing price shows where today’s trading session ended within this range.
The negative multiplier (-100) creates an inverted scale, where values closer to zero signal stronger buying momentum, while values nearer to -100 suggest heightened selling pressure. This structure helps traders easily spot market extremes.
Now that the formula is clear, the next step is to interpret its readings.
Reading the Indicator Range
The Williams %R operates within a fixed range of 0 to -100, making it straightforward to assess market conditions. This bounded range avoids the complexity of unbounded indicators and simplifies decision-making.
- Overbought conditions occur when the indicator rises above -20. At this point, the closing price is near the period’s highest high, signaling a potential reversal. For instance, a reading of -15 suggests the price is just 15% below the peak, often hinting at a pullback.
- Oversold conditions arise when the indicator falls below -80. Here, the closing price is close to the period’s lowest low, indicating that selling pressure may be fading. A reading of -85 means the price is only 15% above the bottom, potentially signaling a buying opportunity.
- The middle range between -20 and -80 represents neutral territory, where neither buyers nor sellers dominate. In this zone, traders often monitor trends or wait for stronger directional signals.
These thresholds provide valuable guidance for timing entries and exits. However, it’s worth noting that extreme readings can persist, especially in strong trends, so additional context is crucial.
Adjusting the Look-Back Period
The standard Williams %R calculation uses a 14-period look-back, but this parameter can be adjusted to suit different trading styles and market conditions. Changing the period length affects the indicator’s sensitivity and the reliability of its signals.
- Shorter periods (e.g., 7 days) make the indicator more responsive, generating frequent overbought and oversold signals. This can be useful for short-term trades but may lead to more false signals, requiring confirmation from other tools.
- Longer periods (e.g., 21 or 28 days) smooth out the oscillations, filtering out market noise. These settings are favored by swing and position traders who focus on multi-day or multi-week trends. The trade-off is slower signals, which might miss part of a move.
For highly volatile assets like cryptocurrencies, extending the look-back period to 20 or 25 days can help reduce false signals caused by erratic price swings. On the other hand, stable large-cap stocks often perform well with shorter settings, such as 10 or 12 days, to capture momentum without excessive noise.
The ideal period also depends on market conditions. In trending markets, shorter periods help traders capitalize on momentum, while longer periods are better suited for sideways or choppy markets to avoid being misled by random fluctuations.
Experimenting with different settings on your preferred assets and timeframes can help you find what aligns with your trading approach. By fine-tuning the look-back period, traders can better interpret overbought and oversold signals and make more informed decisions in real time.
Williams %R Indicator — Trading Secrets & Top Strategy Ideas
Reading Overbought and Oversold Levels
This section breaks down how to interpret key signals from the Williams %R indicator to identify potential market entry and exit points.
Spotting Overbought Conditions
When Williams %R rises above -20, it signals overbought conditions, meaning the closing price is nearing the period's highest high. This often reflects diminishing buying pressure. (For specific thresholds, see the indicator range section.)
The closer the reading is to 0, the more extreme the overbought condition. For instance, a reading of -5 indicates the closing price is just 5% below the period's peak. Such extreme levels often precede short-term pullbacks, especially in stocks experiencing rapid gains. However, keep in mind that overbought conditions can persist during strong upward trends.
To improve reliability, look for confirmation signals like divergences between Williams %R and price movements or declining trading volume. These signs often point to weakening momentum.
Finding Oversold Conditions
A Williams %R reading below -80 points to oversold conditions, where the closing price is close to the period's lowest low, indicating reduced selling pressure.
More extreme readings, such as -95, suggest the price is near the absolute low for the period, implying that most selling activity has already occurred. While these levels may signal a potential bounce, they should be interpreted cautiously during extended downtrends or when underlying fundamentals remain weak.
Positive divergence — when a stock hits new lows but Williams %R forms higher lows — can indicate fading selling pressure. Pairing oversold readings with additional technical support levels can make reversal signals more dependable, providing valuable insights for real-time trading strategies.
Using Williams %R in U.S. Markets
The regular trading session (9:30 AM–4:00 PM ET) presents distinct patterns that can help refine the interpretation of Williams %R signals (official hours overview).
Pre-market and after-hours trading activity often skews the indicator. For instance, an opening gap can push Williams %R into extreme levels, but these signals may not reflect a true shift in momentum.
The first hour of trading (9:30 AM–10:30 AM ET) is typically volatile, which can lead to misleading overbought or oversold signals. Many traders prefer to wait until after this period to confirm whether these conditions represent genuine momentum changes rather than early-session noise.
Sector-specific trends also play a role. Volatile sectors like technology frequently produce extreme Williams %R readings, while steadier sectors, such as utilities, rarely hit traditional overbought or oversold levels.
Additionally, earnings reports and major economic announcements can distort readings. Use caution when interpreting extreme values during these times. Lastly, the final hour of trading, often referred to as the "power hour" (3:00 PM–4:00 PM ET), tends to see increased activity. Williams %R signals during this time can offer clues about market sentiment heading into the next trading day.
Trading Strategies with Williams %R
Building effective trading strategies using Williams %R involves more than just understanding the indicator — it’s about mastering how to time entries and exits, fine-tune settings for different assets, and leverage real-time tools for better decision-making. These methods expand on earlier concepts to help traders apply Williams %R effectively in live markets.
Entry and Exit Signals
Williams %R can be valuable for timing trades, but it works best when paired with additional analysis. On its own, the indicator can sometimes give false signals, particularly in strong trending markets where prices may stay in overbought or oversold zones for extended periods.
A smart way to use Williams %R is by combining it with support and resistance levels. For example, if the indicator shows oversold conditions while the price touches a key support level, it could signal a higher-probability buying opportunity. Similarly, overbought readings near resistance levels can help identify potential sell points.
Another powerful technique is analyzing divergence patterns. For instance, when prices hit new lows but Williams %R forms higher lows, this bullish divergence may suggest weakening selling pressure and a potential upward move. Conversely, bearish divergences — where prices make new highs but Williams %R forms lower highs — can indicate fading buying momentum and a possible reversal.
Regardless of how strong a signal looks, risk management is essential. Use stop-loss orders to safeguard trades — placing them just below support levels for long positions or above resistance levels for short positions. This approach helps protect against unexpected price moves and false breakouts.
Real-Time Trading Tools
Real-time tools can improve Williams %R strategies by enabling faster, more accurate execution. Platforms like TradingView and LuxAlgo provide customizable features that complement Williams %R, including divergence detection and curated screeners.
For example, LuxAlgo’s Oscillator Matrix enhances Williams %R analysis by automatically identifying divergences between the indicator and price action. It also incorporates money flow data to add another layer of insight. Imagine Williams %R showing oversold conditions while money flow suggests accumulation — this combination can signal a stronger likelihood of a price reversal.
Important: Williams %R itself is not a LuxAlgo product. Instead, you can use LuxAlgo alongside Williams %R — for example, by pairing Williams %R readings with LuxAlgo’s support/resistance tools, divergence detection, and screeners — to build and test strategies more efficiently.
To stay on top of trading opportunities without constantly monitoring charts, traders can set up custom alerts for key threshold crossings. LuxAlgo provides screeners on TradingView that can scan hundreds of assets for Williams %R setups, making it easier to track multiple markets and find new trading opportunities.
Setting Look-Back Periods for Different Assets
"The default setting for the Williams %R is 14 periods, suitable for many markets, but adjusting this can enhance its effectiveness." – Finlogix [2]
The default 14-period setting works well for many situations, but adjusting it based on the asset and trading style can improve results. For day trading or scalping, shorter periods like 5–10 are often better suited to capture quick price movements. For swing trading, longer periods such as 20–30 provide a smoother view of momentum. Position traders might even go beyond 21 periods to focus on broader trends.
For currency pairs, adjusting the look-back period during high-liquidity times — like the London–New York overlap (8:00 AM–12:00 PM ET) — can yield better results. Testing different settings is crucial for fine-tuning the indicator to match the volatility of the asset.
Some traders take this further by using multiple Williams %R settings at once. For example, combining a 14-period and a 50-period Williams %R can provide insights into short-term momentum within a longer-term trend. Additionally, multi-timeframe analysis can strengthen signals: use a daily chart with a 14-period setting to identify the overall trend, then switch to an hourly chart with a 9-period setting for precise entries.
Williams %R Limitations and Best Practices
Williams %R can be a helpful tool in a trader's arsenal, but like any technical indicator, it has its shortcomings. Misusing it or ignoring its limitations can lead to costly mistakes. Understanding these weaknesses and applying best practices can make a significant difference in your trading outcomes.
Common Limitations
One of the main challenges with Williams %R is its tendency to produce misleading signals during strong trends. For instance, in a strong upward trend, the indicator might stay in the overbought zone for an extended period, even as prices keep climbing. Similarly, during sharp downward trends, it can remain in oversold territory for weeks, potentially leading traders to enter positions prematurely.
In sideways or choppy markets, the indicator's rapid shifts between overbought and oversold levels can create multiple false signals. This can result in frequent, small losses that add up quickly, especially when factoring in transaction costs.
Another issue is that Williams %R lacks precision in timing. While it can highlight overbought or oversold conditions, it doesn’t pinpoint when a reversal will actually happen. For example, an oversold reading might persist for a while before the market turns around, leaving traders in a tough spot if they act too soon.
The indicator is also sensitive to market volatility. Events like earnings announcements or Federal Reserve meetings can cause extreme readings that don’t necessarily reflect true momentum, making it harder to rely on the signals during such times.
To address these issues, it’s crucial to use Williams %R alongside other tools and strategies.
Combining Williams %R with Other Tools
To improve the reliability of Williams %R signals, it’s a good idea to combine it with other technical indicators. For example, pairing it with moving averages can help filter out trades that go against the prevailing trend. A useful approach might be to only act on oversold signals when the price is above the 50-day moving average.
Volume analysis can also add an extra layer of confirmation. If Williams %R shows oversold conditions and there’s a noticeable increase in trading volume, it indicates genuine buying interest rather than just a technical signal. On the flip side, overbought readings paired with declining volume might suggest weakening momentum and a higher likelihood of a reversal.
Support and resistance levels are another effective complement to Williams %R. Instead of acting on overbought or oversold readings alone, look for these signals near key technical levels. For instance, an oversold reading at a support level carries much more weight than one occurring in the middle of a trading range.
You can also use the Relative Strength Index (RSI) alongside Williams %R for confirmation. When both indicators align — showing similar overbought or oversold conditions — the signal becomes stronger. However, if they diverge, it’s often wise to wait for clearer confirmation before making a move.
Using LuxAlgo Tools for Better Results
LuxAlgo provides advanced features and automation that you can use alongside Williams %R to refine your strategies. The Oscillator Matrix, for example, can automatically detect divergences between price action and Williams %R-style momentum, giving you a head start on spotting potential reversals.
The AI Backtesting Assistant helps you test different Williams %R settings across various market conditions, so you can find the best configuration for specific assets. For example, you might discover that a 21-period setting works better for Apple stock during earnings season, while the standard 14-period setting is more effective in calmer markets.
LuxAlgo’s screeners can save you hours by scanning hundreds of U.S. stocks for Williams %R setups. You can filter for conditions like oversold readings combined with bullish divergence patterns, making it easier to identify promising opportunities across entire sectors.
To tackle timing challenges, LuxAlgo’s custom alert system can notify you when Williams %R crosses key thresholds while meeting other criteria, such as oversold conditions near support levels with rising volume.
For traders in the U.S., LuxAlgo’s Premium and Ultimate plans provide real-time market scanning during active trading hours (9:30 AM–4:00 PM ET). The Ultimate plan also includes optimization tools that help you adjust parameters based on changing market volatility.
Finally, LuxAlgo’s community features offer a space to learn from experienced traders who share their strategies and insights.
Conclusion
The Williams %R indicator is a momentum oscillator that helps traders spot potential overbought and oversold conditions in financial markets. In this guide, we’ve covered how this indicator can be a valuable addition to your trading strategy when used thoughtfully and with a clear understanding of its strengths and limitations.
Key Points Summary
Williams %R works best when combined with other technical tools rather than being used on its own. Pairing it with moving averages, volume analysis, support and resistance levels, or other oscillators like RSI can provide stronger confirmation signals to enhance your trading decisions.
It’s important to recognize the indicator’s limitations, especially in strong trending markets. Williams %R can stay in extreme zones for extended periods, which may lead to premature trade entries if you rely solely on its signals. Timing remains a challenge, as the indicator highlights conditions but doesn’t pinpoint exact entry or exit points, making confirmation from other tools essential.
For U.S. traders, Williams %R can be applied across various asset classes, including individual stocks, futures contracts, and forex pairs. Adjusting the look-back period to match an asset’s volatility and your trading timeframe is key to optimizing its effectiveness.
With these insights, you’re better equipped to explore how Williams %R can fit into your trading strategy.
Getting Started with Williams %R
To begin, test the Williams %R indicator on established U.S. trading platforms that offer robust technical analysis features. Experiment with different look-back periods to identify what aligns with your trading style. While the standard 14-period setting is a solid starting point, shorter periods can provide more sensitive signals, and longer periods can smooth out readings.
"To fully leverage the power of the Williams Percent Range indicator, it is crucial to use a robust and interactive charting environment. This is where LightningChart JS Trader comes into play." [1]
Before using real money, backtest your strategy to see how it performs under different market conditions. This step helps you fine-tune the indicator’s settings and set realistic expectations for its use in live trading.
Platforms like LuxAlgo offer features that enhance Williams %R analysis. Tools such as automated divergence detection in the Oscillator Matrix and the AI Backtesting Assistant streamline your strategy development. Real-time screening tools can quickly identify Williams %R setups across hundreds of U.S. stocks during trading hours (9:30 AM–4:00 PM ET), saving you valuable time.
Trading with Williams %R requires patience, discipline, and continuous learning. Start with paper trading or small positions to build confidence in your approach. And no matter how promising a setup looks, always stick to proper risk management to protect your capital.
FAQs
How can I use the Williams %R indicator with other tools to improve my trading decisions?
To improve your trading decisions, consider combining the Williams %R indicator with other technical tools to confirm signals and boost accuracy. For instance, pairing it with moving averages or identifying support and resistance levels can help verify overbought or oversold conditions, reducing the risk of relying on a single indicator.
You can also use the Williams %R alongside volume analysis or chart patterns to enhance signal reliability. This approach is particularly useful for spotting potential trend reversals or breakout opportunities. By integrating these tools, you get a broader perspective on market trends, allowing for more informed and confident trading decisions.
How can I adjust the look-back period of the Williams %R indicator to match different market conditions?
The Williams %R indicator can be tailored to align with your trading objectives and the market you're working in. For short-term trades, a shorter look-back period, such as 5–10 days, is useful for spotting quick price reversals. If you're focusing on longer-term trends, extending the period to 14–20 days can help filter out market noise and deliver smoother signals.
When fine-tuning this indicator, think about factors like market volatility and the asset you're studying. In highly volatile markets, shorter periods can provide more responsive signals. On the other hand, in calmer, less volatile markets, longer periods may work better. It's a good idea to experiment with various settings through backtesting to determine what works best for your trading approach.
How does the Williams %R indicator perform in strong trends, and what strategies can help address its weaknesses?
The Williams %R indicator works best for spotting overbought and oversold conditions. However, it tends to struggle in markets with strong trends, often leading to false signals or whipsaws. This is because the indicator isn’t built to confirm trends but rather to point out potential reversals.
To overcome these challenges, try pairing Williams %R with trend-following tools like moving averages or focus on price action to verify the market's overall direction. It’s also more effective in sideways or range-bound markets, where volatility is lower, making its signals more reliable.
References
LuxAlgo
- Pullback Trading vs. Trend Reversals
- Understanding Moving Averages and How Traders Use Them
- Support & Resistance Dynamic (Indicator)
- Volumetric Toolkit (Indicator)
- Sessions (Indicator)
- Trending Market Toolkit (Indicator)
- Market Sentiment Technicals (Indicator)
- Support & Resistance Levels with Breaks (Indicator)
- Oscillator Matrix (Indicator)
- Price Action Concepts (Indicator)
- Money Flow Profile (Indicator)
- Oscillator Matrix — Reversal Signals (Docs)
- AI Backtesting Assistant — Breakdown
- Alert Scripting Update: Actions
- Adaptive Momentum Oscillator (Indicator)


