Correlation Clusters
 By LuxAlgoAug 15, 2024
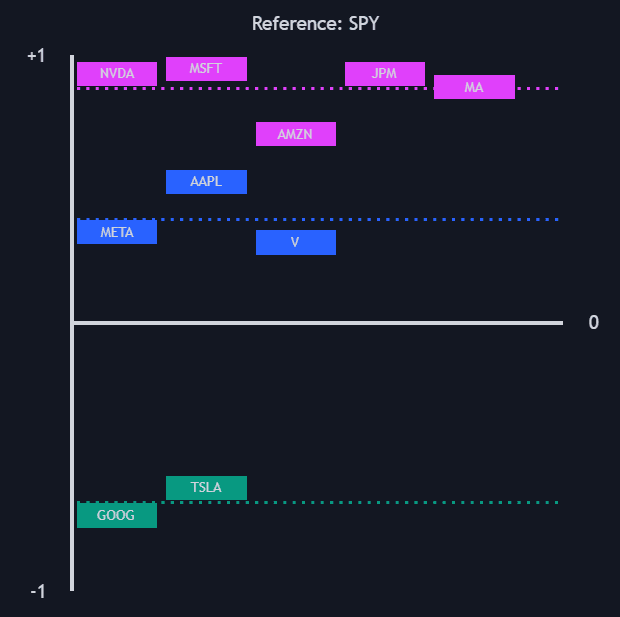
Correlation Clusters measures how closely up to ten user-selected tickers track a reference symbol, then sorts them into like-behaving groups automatically. Each pairwise correlation coefficient falls between +1 (moving in tandem) and -1 (moving inversely), and a k-means clustering pass groups tickers with similar coefficients — up to ten clusters, each color-coded with a dotted centroid line — replacing the manual grind of reading a correlation matrix.
How to Trade the Correlation Clusters?
- Same cluster, same risk: grouped tickers tend to move together — stacked longs across one cluster concentrate exposure rather than diversify it.
- Clusters near zero: behave independently of the reference, the natural place to hunt genuine diversification.
- Strongly negative clusters: inverse movers, useful for hedging reference-aligned positions.
- Divergence inside a tight cluster: when two highly correlated tickers temporarily split, pair traders buy one and sell the other anticipating reconvergence.
The Execution Window controls the sample: correlations can be gathered over a bar count, a time span such as a day or a week, or all available data, with the default drawing on the last 50 bars. Different windows tell different stories about the same assets, so match the sample to how long you hold.
Correlation Clusters Settings
- Execution Window Mode: collect data by bars, by time, or without filtering.
- Execute on Last X Bars / Execute on Last: the sample size for the bars and time modes.
- Number of Clusters: up to 10 — the algorithm may return fewer when the data lacks distinct groups.
- Cluster Threshold / Max Iterations: centroid precision and the iteration budget; defaults suit most uses.
- Use Chart Ticker as Reference / Custom Ticker: benchmark against the charted symbol or any symbol you specify.
- Style: text size, display size, box height, and per-cluster colors.
Frequently Asked Questions
Why do I sometimes get fewer clusters than requested?
K-means only forms groups it can genuinely distinguish. When several tickers share very similar coefficients, requested clusters collapse together — itself a clue that the basket is uniform.
How is this different from a single correlation readout?
The Correlation Coefficient tracks one relationship through time. Correlation Clusters photographs ten at once and organizes them, which is what makes portfolio-level concentration visible in one panel.
How do I access Correlation Clusters?
Free, via the LuxAlgo Library page. To experiment immediately, Quant — LuxAlgo's AI — can run the tool directly from here.
Free indicator
Get free access to this indicator on the platforms below.

The Library is free. Quant makes it yours.
Pull any concept or indicator into Quant: rebuild it, retune it, or turn it into a backtested strategy of your own.