Concept
K-means Regime Clustering
K-means Regime Clustering is a Machine Learning concept. The Library holds 6 implementations, each one a working definition you can pull into Quant.
Top K-means Regime Clustering indicators
The top custom implementations, built on the original standard K-means Regime Clustering formula.
6 total
From studying K-means Regime Clustering to trading it: take any implementation below into Quant and backtest it instantly.
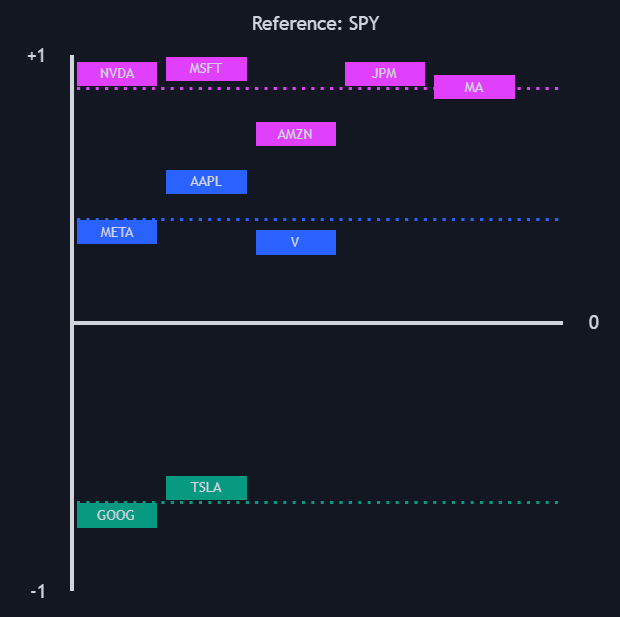
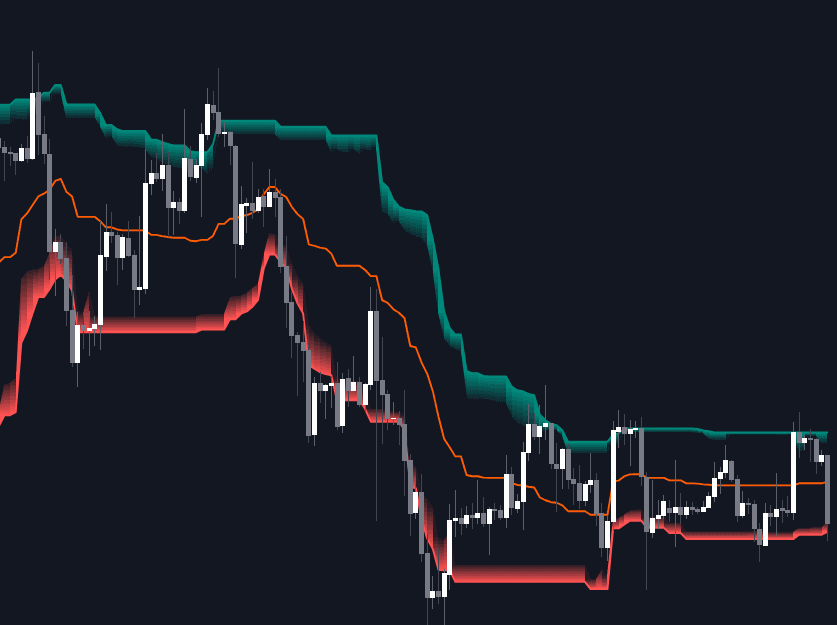
.png&w=3840&q=75)
What is K-means Regime Clustering?
K-means is an unsupervised algorithm that partitions observations into k groups. It alternates two steps until assignments stop changing: assign each observation to its nearest centroid by Euclidean distance, then move each centroid to the mean of the observations assigned to it, a loop that drives within-cluster variance to a local minimum. Applied to markets, the observations are feature values collected over a lookback window, such as ATR readings, realized volatility, or trend-strength measures, and the resulting clusters are read as regimes: data-defined low, medium, and high states rather than fixed thresholds. The current bar's regime is simply the cluster whose centroid its features sit closest to.
This matters because most indicator settings are regime-dependent: a trailing multiplier that fits a quiet market is too tight in a volatile one, and clustering lets recent data decide what counts as quiet or volatile. The limits are classical. K must be chosen in advance; convergence is to a local optimum that depends on initialization; distance-based assignment assumes features are scaled comparably; and the clusters describe the present without saying anything about when the regime will switch. Labels also flip easily near cluster boundaries, so stable use usually adds confirmation or hysteresis.
How to calculate a k-means regime label
The loop itself is short; the design choices around it (features, scaling, k) decide whether the labels mean anything.
- 1Build the feature set: collect the values to be clustered over a lookback window and scale them so no single feature dominates the distance.
- 2Initialize k centroids, commonly by picking k observations or spreading starting points across the data's range.
- 3Iterate: assign every observation to its nearest centroid, then move each centroid to the mean of its members; stop when assignments no longer change.
- 4Label the current bar by its nearest centroid and read that centroid's values as the regime's characteristic level, for example the volatility that defines the high state.
How traders use it
- For volatility regimes: a window of ATR or realized-volatility values is clustered into a few groups and the current cluster gates behavior, a data-driven form of volatility regime classification.
- For adaptive settings: candidate parameter values are scored on recent performance, the scores are clustered, and the winning cluster's centroid is adopted, so something like a Supertrend factor is selected from the data, one flavor of adaptive parameterization.
- For level discovery: clustering prices themselves turns centroids into candidate support and resistance zones, the same idea used by dedicated level clustering algorithms.
- For strategy switching: bars labeled by cluster drive a trend-versus-range decision, enabling trend-following logic in one regime and mean-reversion logic in another.
K-means Regime Clustering vs other regime models
Gaussian Mixture Models: GMMs make soft, probabilistic assignments and allow clusters with different shapes and spreads; k-means makes hard nearest-centroid assignments and implicitly favors similar, roughly spherical clusters.
Hidden Markov / Markov-switching Regimes: Markov-switching models treat regimes as hidden states with transition probabilities, so sequence and persistence are modeled explicitly; k-means clusters each observation with no notion of time order.
Volatility Regime Classification: The broader task: regimes can also be classified with fixed thresholds or percentile cutoffs. K-means is one way of letting the data set those boundaries instead of choosing them by hand.
More K-means Regime Clustering implementations
Concept family
Machine Learning
32 concepts mapped · 32 in the Library
K-means Regime Clustering FAQ
Turn K-means Regime Clustering into a trading strategy.
Take any implementation from this page into Quant, then build on it, backtest it on real data, and keep refining it in conversation.