Correlation Coefficient
 By LuxAlgoApr 13, 2020
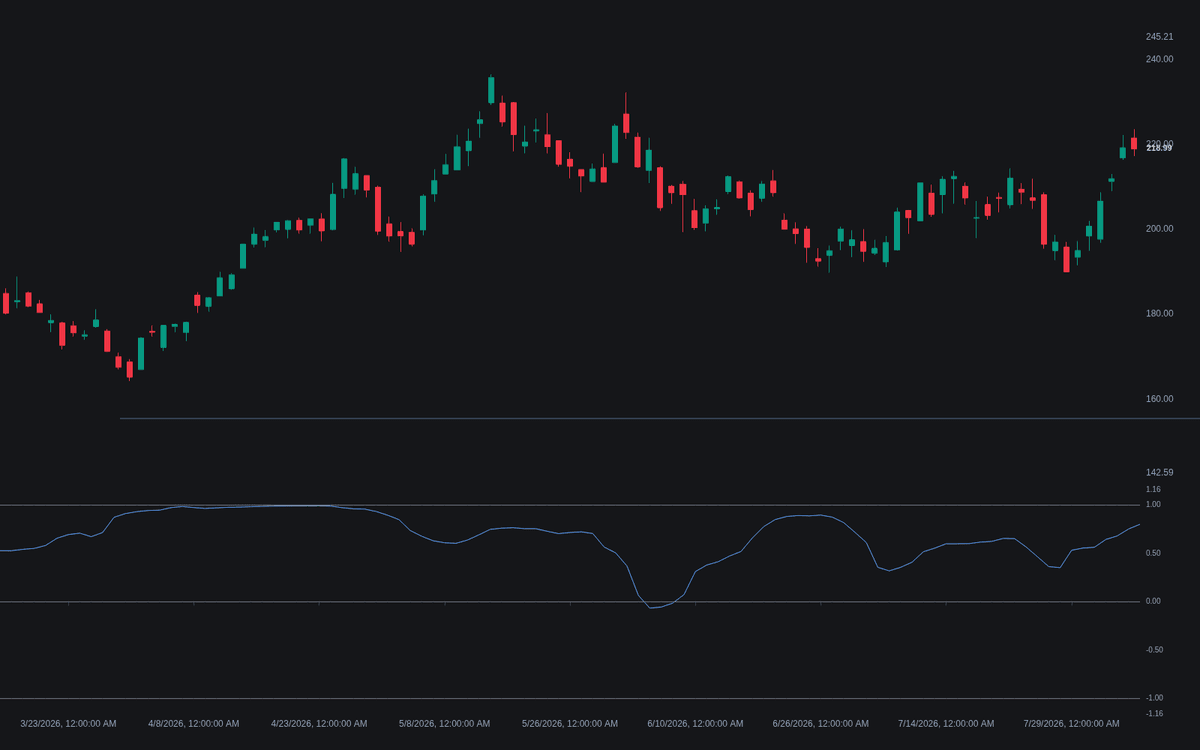

The Correlation Coefficient measures how consistently the chart symbol moves with a second, user-selected symbol, plotting the Pearson correlation over a rolling window as an oscillator bounded between -1 and +1. A reading near +1 says the two series rise and fall together; near -1, they move opposite ways; near zero, no stable linear relationship exists.
This build is the standard raw calculation: the chart symbol is compared against a comparison symbol input (the S&P 500 by default) over a 20-bar window, with an option to correlate log returns instead of raw prices. The Correlation line is drawn with a soft area fill, framed by dotted levels at +1, zero, and -1.
How to Trade the Correlation Coefficient?
- Near +1: the two symbols move in near-lockstep; holding both adds exposure, not diversification.
- Near -1: consistent opposite movement, the profile a hedge is supposed to have.
- Around zero: no dependable relationship; treat the pair as independent.
- Zero-line crosses: the sign has flipped; alert conditions cover crosses above and below zero.
- Drift from an extreme toward zero: a once-tight relationship is decoupling.
Correlation frames trades rather than triggering them: use it to size, filter, or veto ideas generated elsewhere.
Correlation Coefficient Settings
- Symbol (default SP:SPX): the instrument the chart symbol is measured against.
- Length (default 20): bars in the rolling window. Shorter reacts fast but whipsaws; longer is steadier but slow to register a real break.
- Source (default close): the price series used for both symbols.
- Use Log Returns (default off): correlates bar-to-bar log returns instead of raw values, stripping the trend effect that inflates raw-price readings.
Frequently Asked Questions

The Library is free. Quant makes it yours.
Pull any concept or indicator into Quant: rebuild it, retune it, or turn it into a backtested strategy of your own.