Crypto Liquidation Heatmap
 By LuxAlgoApr 23, 2024
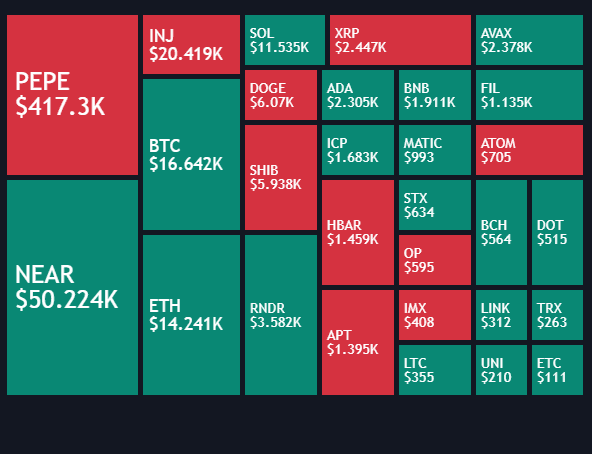

The Crypto Liquidation Heatmap condenses forced-liquidation activity across the top 29 cryptocurrencies by market capitalization into one ranked display. Assets with the heaviest estimated liquidations sort to the top, so leverage flushes stand out instantly, the same forced closures that stack into liquidation clusters around crowded price zones. And unlike a resting liquidity heatmap, which maps orders waiting in the book, this display tracks positions already being closed by force.
How to Trade the Crypto Liquidation Heatmap?
- Ranking: boxes sort in descending order of liquidation value. The top rows are where leverage is being flushed hardest right now.
- Green boxes: long liquidations exceed shorts, the footprint of longs forced out as price drops.
- Red boxes: short liquidations dominate: shorts squeezed by a price spike.
- Hover details: each box reveals the asset's current price, its long and short liquidation breakdown, and the timeframe measured.
Complete liquidation feeds are not readily available, so the tool estimates values from the strong relationship between liquidations, trading volume, and price movement. Read the heatmap as proportion and trend rather than exact totals.
Crypto Liquidation Heatmap Settings
- Crypto Asset Options: the monitored list, defaulting to the top 29 cryptos by market cap from a single exchange; only crypto assets are supported.
- Position / Size: where the heatmap anchors on the chart and how large it renders.
Keep every selected instrument on the same exchange and quoted in the same currency (USD, USDT, USDC, USDP, or USDD): volumes differ across venues, and mixed quotes skew the estimates.
Frequently Asked Questions
Free on Vela
Run it on Vela. Go further with a paid plan.
- Up to 500 strategy alerts, with webhook automation
- Up to 10× the chart history of Free
- Orderflow lookback up to full history
- Up to 100,000 monthly credits for Quant to customize it
- Futures data alongside crypto, stocks, forex and commodities
Also on other platforms
Get free access to this indicator elsewhere.

Run it on Vela. Make it yours with Quant.
Open this indicator free on Vela, our state-of-the-art charts. Then ask Quant, our coding agent built into Vela, to retune it or turn it into a backtested strategy of your own.