Concept
Liquidation Clusters
Liquidation Clusters, also known as cascades, are Breadth, Sentiment & External Data concepts. The Library holds 5 implementations, each one a working definition you can pull into Quant.
Top Liquidation Clusters indicators
The top custom implementations, built on the original standard Liquidation Clusters formula.
5 total
Every Liquidation Clusters implementation here is strategy-ready: open one in Quant, set your rules, and it backtests automatically.
What are Liquidation Clusters?
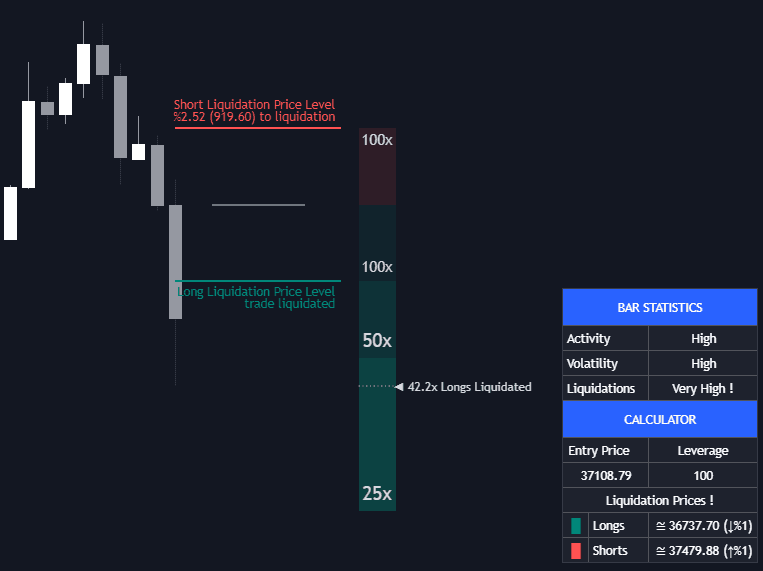
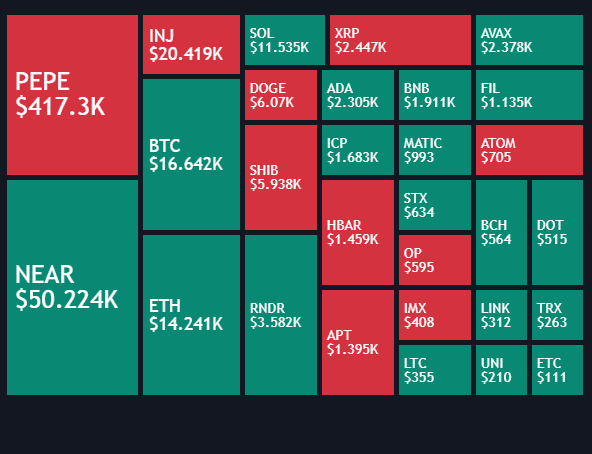
Liquidation clusters are price zones where a large amount of leveraged derivative exposure would be force-closed if the market traded there. Every leveraged position, most visibly in crypto perpetual futures, carries a liquidation price set by its entry, leverage, and margin; when price reaches it, the exchange closes the position with a market order. Because traders enter at similar prices and choose round leverage tiers (10x, 25x, 50x), those liquidation prices bunch together. A cluster is therefore a pocket of conditional forced order flow: long liquidations sit below the market and fire as forced selling, short liquidations sit above and fire as forced buying.
When price enters a dense cluster, the forced orders themselves push price deeper, triggering the next tier of liquidations: a cascade. The footprint is a sudden wick, a vertical drop in open interest, and often a snap in the funding rate. One caveat governs everything: exchanges do not publish individual liquidation prices, so cluster maps are estimates built from open-interest changes and assumed leverage distributions. Treat a liquidation heatmap as a probability surface, not a ledger of real orders.
How to read a liquidation heatmap
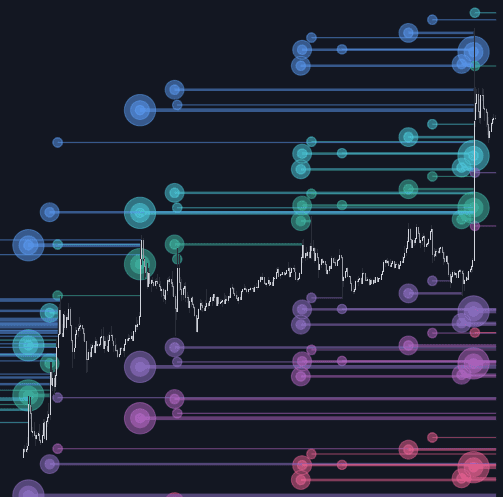
Heatmaps paint estimated liquidation density above and below price, with brightness encoding the size of the estimated pool.
- 1Orient by side: bands above price are estimated short liquidations (forced buying if reached), bands below are long liquidations (forced selling). The denser the band, the more fuel it is estimated to hold.
- 2Judge asymmetry: a market with heavy clusters overhead and little below leans toward an upside squeeze as the path of least resistance, and the reverse for dense clusters underneath.
- 3Watch behavior on contact: acceleration into the band followed by reversal once it clears suggests the fuel was swept and spent, while continued trending through it suggests genuine directional flow beyond the forced orders.
- 4Confirm with open interest and funding: a real cascade shows OI collapsing as the band is hit; if OI barely moves, the map overstated what was there.
How traders use it
- As magnet-style targets: dense clusters function like liquidity pools, plausible destinations for a move, since forced flow and the traders anticipating it both live there. Price often works toward them, but nothing obliges it to arrive.
- As squeeze setups: entering after a cluster is swept and price reclaims the level treats the cascade as exhaust, similar in logic to trading a liquidity sweep; once the forced side is cleared, one source of opposing pressure is gone.
- As risk management: placing a stop just inside a dense cluster invites being filled by cascade wicks, so stops go beyond the cluster, or the trade gets sized for the volatility those zones produce.
Liquidation Clusters vs related concepts
Liquidity Pool: A liquidity pool is the general concept: resting stops and orders gathered at obvious levels. Liquidation clusters are a specific, derivatives-driven case where the resting flow is forced closure of leveraged positions rather than chosen stop placement.
Resting Liquidity / Liquidity Heatmap: Order-book heatmaps display limit orders actually visible in the book; liquidation heatmaps display estimated forced-order levels that do not exist until triggered. One shows orders that exist now but can still be pulled, the other a model of potential.
Open Interest: Open interest measures how much leveraged exposure exists; liquidation clusters estimate where it breaks. OI is the fuel gauge, clusters are the map of where the fuel is stored.
More Liquidation Clusters implementations
Concept family
Breadth, Sentiment & External Data
63 concepts mapped · 63 in the Library
Liquidation Clusters FAQ
Turn Liquidation Clusters into a trading strategy.
Take any implementation from this page into Quant, then build on it, backtest it on real data, and keep refining it in conversation.