Concept
Resting Liquidity / Liquidity Heatmap
Resting Liquidity / Liquidity Heatmap is a Volume & Order Flow concept. The Library holds 5 implementations, each one a working definition you can pull into Quant.
Top Resting Liquidity / Liquidity Heatmap indicators
The top custom implementations, built on the original standard Resting Liquidity / Liquidity Heatmap formula.
5 total
From studying Resting Liquidity / Liquidity Heatmap to trading it: take any implementation below into Quant and backtest it instantly.
.png&w=3840&q=75)
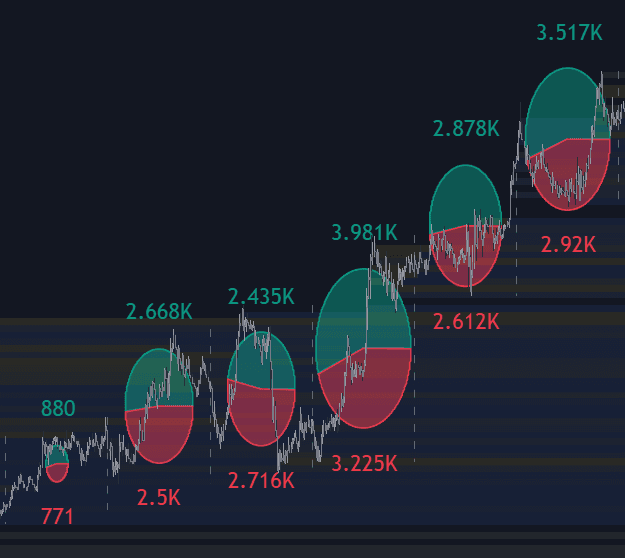
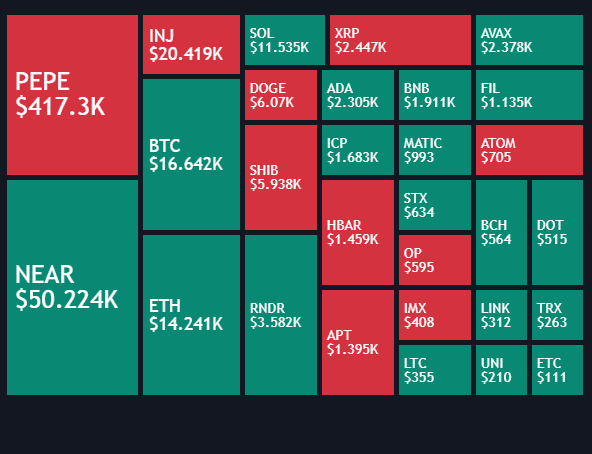
What are Resting Liquidity and Liquidity Heatmaps?
Resting liquidity is every order parked in the market rather than chasing it: passive limit orders sitting in the order book waiting for price to come to them, plus the stop orders clustered beyond obvious highs and lows that fire as market orders when touched. A liquidity heatmap visualizes the first kind. It samples the visible depth of market at regular intervals and colors each price level by the size of the orders resting there, so a large, persistent wall appears as a bright horizontal band that price can be watched approaching, consuming, or rejecting.
The caveats are structural. A heatmap shows only displayed limit orders on the venue it samples; orders can be modified or pulled the moment price gets close (spoofing is the adversarial version of this), and stop orders never appear in the book at all, which is why stop-driven liquidity pools are inferred from structure rather than observed. Read a heatmap as a map of advertised interest, not a promise of what will still be there when price arrives.
Construction explains the picture: the tool snapshots the order book on a schedule and lays the snapshots side by side, producing a price-by-time matrix whose color encodes resting size. Persistence becomes readable at a glance, walls that sit through hours of trading versus placements that flicker in and out as price approaches, and consumed bands leave a visible record of where passive interest actually filled. Where raw depth data is unavailable, chart-side approximations such as LuxAlgo's Liquidity Heatmap LTF infer likely resting-interest zones from traded volume and price behavior instead, an honest estimate rather than a book display, and bubble-style hybrids overlay trade-size markers on the same canvas.
In leveraged markets a second map matters: liquidation heatmaps estimate where forced exits would trigger, projecting likely liquidation prices from open interest and price history, which is what LuxAlgo's Crypto Liquidation Heatmap approximates. The two maps describe opposite mechanics, passive orders waiting to absorb versus forced orders waiting to detonate, and price is routinely drawn toward both, for the unglamorous reason that size can only be executed where liquidity exists. Hidden depth cuts both ways: iceberg orders understate real interest on the display, while spoofed size overstates it, so behavior on approach outranks brightness on the screen.
How to read a liquidity heatmap
The display is dense but the reading protocol is short: know the source, grade the persistence, watch the interaction.
- 1Confirm the data source first: genuine depth snapshots from a venue, an aggregate across venues, or a chart-based estimate; each earns a different level of trust.
- 2Orient the axes: price vertically, time horizontally, color intensity encoding the resting size at each level in each snapshot.
- 3Grade bands by persistence: walls that survive many snapshots and multiple approaches carry weight; size that appears only when price is far away and vanishes on approach is advertising, not intent.
- 4Watch the interaction when price arrives: absorption (price stalls while the band drains), pull (the band vanishes before touch), or rejection (price turns at the band) each tell a different story.
- 5Add the invisible layer mentally: stop pools beyond swing extremes and equal highs or lows never show on the display, so the visible map is always half the picture.
How traders use it
- As context for levels: a thick band of resting orders lining up with a technical level adds weight to it, and watching whether the wall absorbs the approach or quietly disappears says more than the level alone.
- For execution decisions: some traders fade price into heavy visible liquidity expecting the wall to slow the move, while others wait for a wall to be eaten through before joining a breakout, on the logic that consumed supply clears the path.
- In crypto, heatmaps are often read alongside liquidation clusters: the visible book shows where passive orders wait, while liquidation maps estimate where forced market orders would trigger.
- Cross-referenced with traded history: heat bands mark advertised intent while high and low volume nodes mark where business actually occurred, and levels where both agree, advertised interest sitting on proven acceptance, rank highest.
- For breakout quality control: a wall genuinely consumed with expanding volume at the break reads as cleared supply, while a wall that was pulled rather than filled leaves a vacuum where the breakout's support should have been.
Liquidity heatmaps vs related order-flow views
Volume Profile: A volume profile aggregates what already traded at each price; a heatmap displays what is currently offered there. Past acceptance versus advertised intent: the profile cannot be faked but is backward-looking, the heatmap is forward-looking but can be withdrawn or spoofed.
DOM: The depth-of-market ladder is the live order book at one instant; the heatmap is the same information given a memory, snapshots laid across time so persistence and pulling behavior become visible. The DOM answers what is there now, the heatmap answers what has been there and for how long.
Liquidation Clusters: Heatmap bands are passive limit orders waiting to absorb price; liquidation bands are estimates of forced market orders waiting to accelerate it. Opposite mechanics under one word: resting liquidity dampens the move that reaches it, liquidation liquidity feeds it.
More Resting Liquidity / Liquidity Heatmap implementations
Concept family
Volume & Order Flow
88 concepts mapped · 88 in the Library
Resting Liquidity / Liquidity Heatmap FAQ
Turn Resting Liquidity / Liquidity Heatmap into a trading strategy.
Take any implementation from this page into Quant, then build on it, backtest it on real data, and keep refining it in conversation.