HTF Candle Consistency
 By LuxAlgoMay 9, 2024
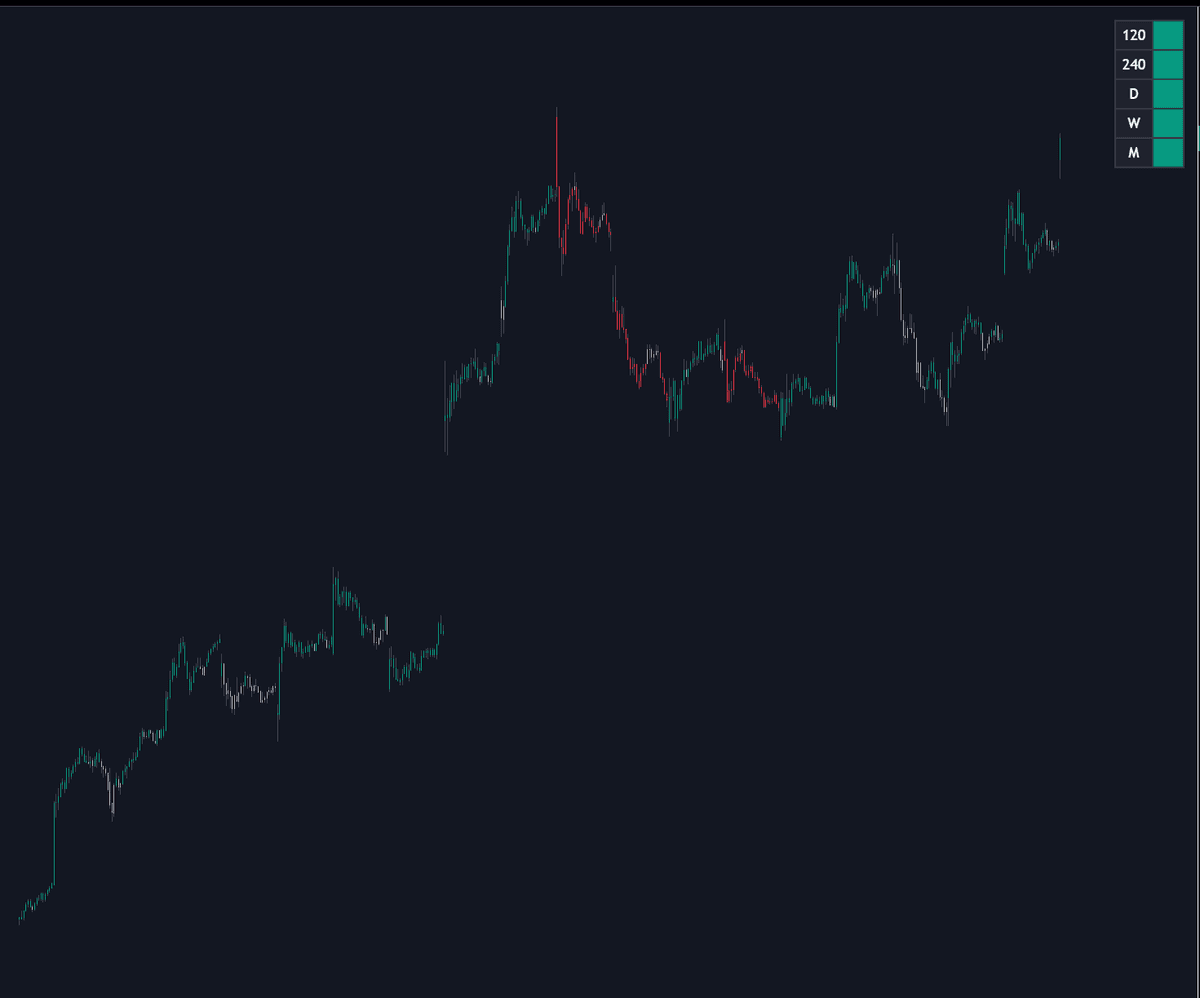
HTF Candle Consistency compresses the market's bigger picture into candle color: it reads the direction of up to 10 higher timeframe candles, applies the weight you assign each one, and paints your chart's candle bodies by the resulting majority — green for bullish dominance, red for bearish. Used this way it behaves as a higher-timeframe trend filter that never asks you to leave the execution chart, with a dashboard breaking out every enabled timeframe's direction behind the vote.
How to Trade the HTF Candle Consistency?
- Green bodies: the weighted majority of your higher timeframes is bullish — conditions favor long-side setups on the chart timeframe.
- Red bodies: bearish dominance across the vote, the mirror condition for shorts.
- Neutral bodies (Tricolor mode): no clear majority — a built-in reason to stand aside until the higher timeframes agree again.
- The dashboard: shows each timeframe's direction individually, revealing whether a majority is broad or hanging on one heavily weighted vote.
The blend you enable shapes the output: widely spread timeframes disagree more often and gray out more candles, while a tighter set produces firmer majorities. Every enabled timeframe must be equal to or higher than the chart timeframe — the dashboard flags an invalid entry in red text — and disabled slots are excluded from both the dashboard and the calculation.
HTF Candle Consistency Settings
- Toggle / Timeframe / Weight: each of the 10 slots can be enabled, pointed at a timeframe, and given a weighting multiplier that scales its influence on the vote.
- Color Mode: Tricolor (default) splits the possible data range into three color states; Bicolor keys off a positive versus negative sum; Gradient blends across a three-color range.
- Dashboard inputs: toggle, placement, size, and vertical or horizontal orientation.
Frequently Asked Questions
What does the weight input actually change?
It multiplies a timeframe's contribution to the majority calculation, letting a daily opinion count for more than an hourly one, or the reverse. Equal weights reduce it to a simple vote.
How is this different from projecting HTF candles onto the chart?
This tool reduces higher timeframe candles to a directional verdict, while HTF Candle Projections draws the candles themselves beside price. They answer different questions — bias versus structure — and run well together.
Is it free to use?
Yes. It is available from the LuxAlgo Library at no charge, and LuxAlgo's AI, Quant, will run it right from this page.
Free indicator
Get free access to this indicator on the platforms below.

The Library is free. Quant makes it yours.
Pull any concept or indicator into Quant: rebuild it, retune it, or turn it into a backtested strategy of your own.