Concept
Top-down Analysis
Top-down Analysis, also known as HTF bias + LTF trigger, fractal transposition, are Meta & Composition concepts. The Library holds 6 implementations, each one a working definition you can pull into Quant.
Top Top-down Analysis indicators
The top custom implementations, built on the original standard Top-down Analysis formula.
6 total
From studying Top-down Analysis to trading it: take any implementation below into Quant and backtest it instantly.
What is Top-down Analysis?
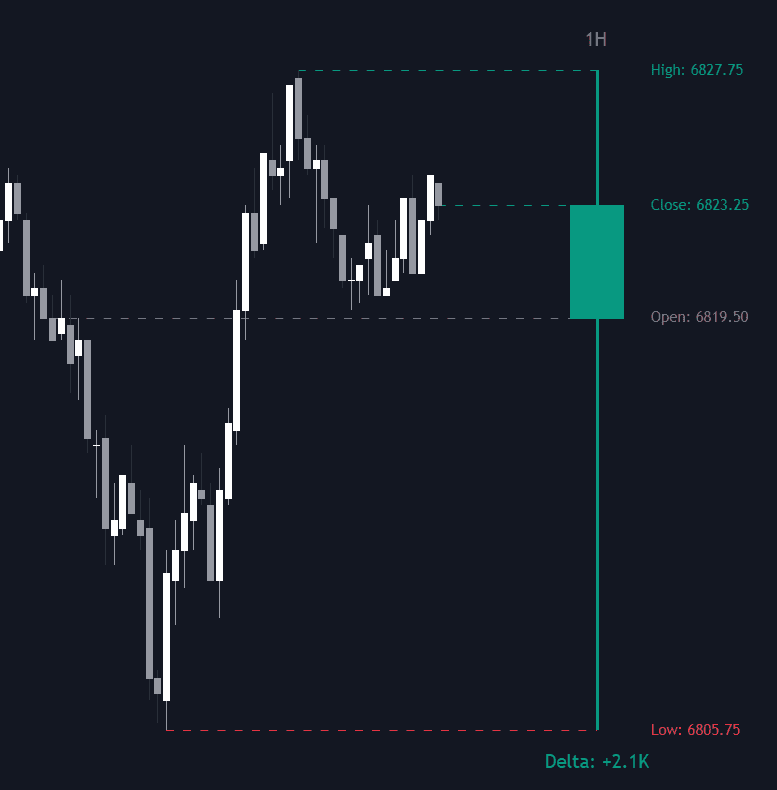
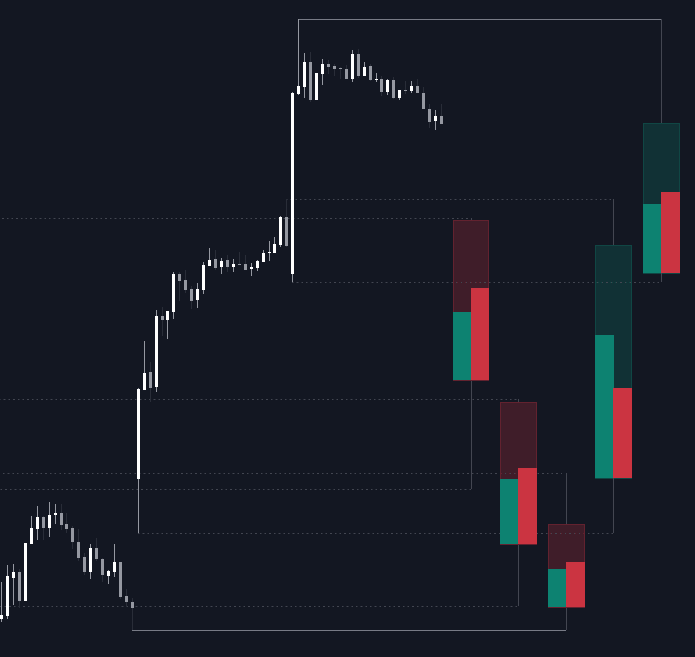
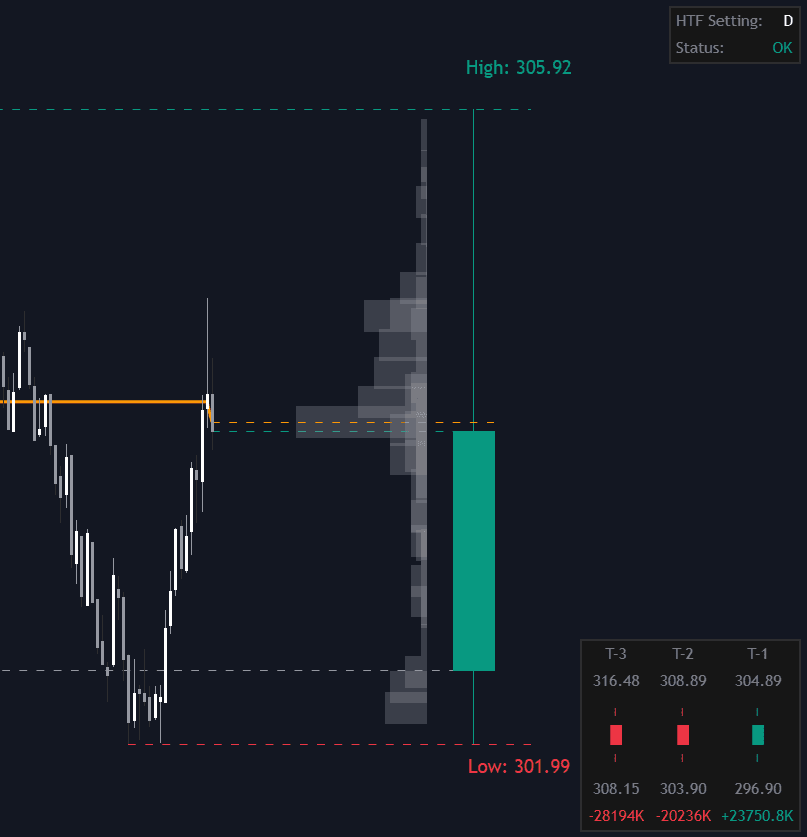
Top-down analysis is a workflow: establish context on higher timeframes first, then descend to lower timeframes to time the trade. The higher-timeframe pass sets directional bias, marks the levels that matter (prior swing highs and lows, prior period levels, untested zones), and locates where price sits within the larger range. The lower-timeframe pass then hunts for entries only in the direction of, and at the locations dictated by, that context. The shorthand "HTF bias, LTF trigger" captures the whole discipline.
The workflow leans on the fractal character of markets: swing structure repeats at every degree, so a full trend on the 5-minute chart is often a single pullback on the 4-hour (fractal nesting makes this precise). Reading top-down prevents the classic error of shorting what is, one degree higher, a routine dip in an uptrend. The best-known codification is Alexander Elder's triple screen: one timeframe for the tide, one for the wave, one for the entry. None of it guarantees direction; it stacks the context, then lets the lower timeframe define a tight invalidation.
How to run a top-down pass
The order of operations is the method: context is settled before the execution chart is ever opened.
- 1Start two or more degrees above your execution timeframe and record the basics: trend direction, the governing range's boundaries, and where current price sits inside it.
- 2Mark the levels that survive scrutiny: prior period highs and lows, untested zones, and the structural swings whose break would change the higher-timeframe story.
- 3Drop one degree and check agreement: is the intermediate timeframe trending with the bias, correcting against it, or contradicting it outright? Contradiction means wait or stand aside.
- 4Only then open the execution timeframe, and only near the marked levels, hunting a trigger in the bias direction with the stop behind the local invalidation.
How traders use it
- As a bias gate: the higher timeframe's trend and structure decide long-only or short-only, and lower-timeframe triggers such as a break of structure are taken solely in that direction.
- As level transposition: levels marked on the weekly or daily are carried down, and the execution chart is consulted only when price actually trades into one of them; HTF-level proximity filters automate the same patience.
- As risk geometry: entering on the lower timeframe puts the stop behind a small, local invalidation while targeting the higher-timeframe objective, which is where the approach's reward-to-risk arithmetic comes from. The win rate is a separate question it does not promise.
- In systematic form: agreement across the ladder is scored rather than eyeballed, so bias becomes a number a strategy can gate on; multi-timeframe alignment scoring is that formalization.
Top-down Analysis vs other multi-timeframe methods
Higher-timeframe Trend Filter: The filter is one rule extracted from the workflow: trade only with the higher timeframe's trend, usually via a moving average or regime test. Top-down analysis is the full pass, covering bias, levels, structure, and location, not just the trend's sign.
MTF Alignment & Confluence Scoring: Alignment scoring systematizes the same instinct: measure agreement across timeframes and emit a score. Top-down analysis is sequential and discretionary, and the higher timeframe holds veto power rather than casting one vote among several.
Multi-timeframe Structure Alignment: Structure alignment asks a narrower question: do swing patterns agree across degrees? Top-down analysis also weighs levels, ranges, and targets, and prescribes an explicit order of operations from high to low.
More Top-down Analysis implementations
Concept family
Meta & Composition
28 concepts mapped · 28 in the Library
Top-down Analysis FAQ
Turn Top-down Analysis into a trading strategy.
Take any implementation from this page into Quant, then build on it, backtest it on real data, and keep refining it in conversation.