Ultimate RSI
 By LuxAlgoSep 1, 2023
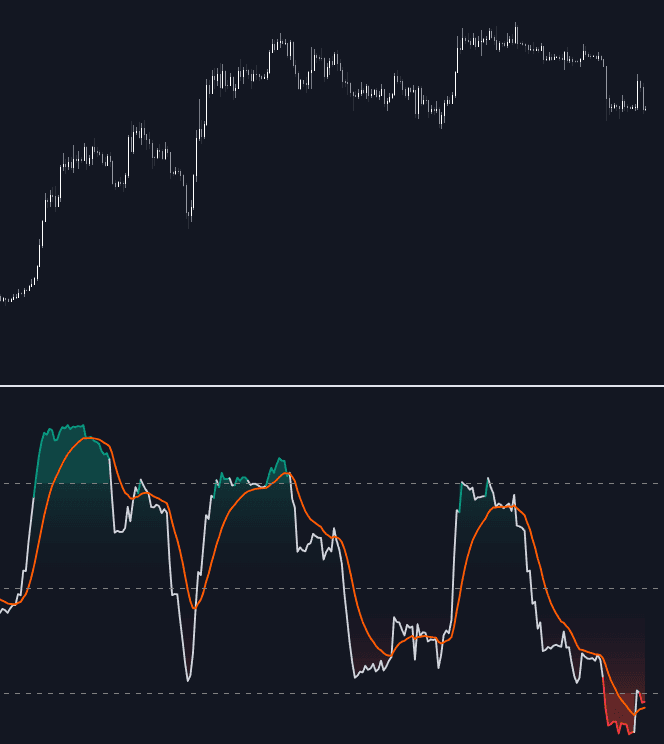
The Ultimate RSI indicator is a cutting-edge tool for traders that enhances the classic Relative Strength Index (RSI) by focusing more on the trend for a clearer, less noisy analysis of market movements. Unlike the traditional contrarian approach associated with the regular RSI, the Ultimate RSI is tailored for trend trading strategies, providing traders with a more reliable indication of the prevailing market direction.
How to Trade with the Ultimate RSI Indicator?
The Ultimate RSI isn't just your regular RSI tool; it's crafted to emphasize trends, allowing traders to identify overbought or oversold conditions more rapidly and sustain them for longer durations. This refinement helps avoid the common pitfalls of the regular RSI, which can often produce false signals during strong trend movements by repeatedly crossing typical overbought or oversold thresholds.
When the Ultimate RSI crosses above the overbought threshold, it often signals a robust uptrend, graphically represented by a green highlight area. Conversely, a crossing below the oversold threshold might suggest a potent downtrend, shown as a red area.
Moreover, the crossover above or below the 50 midline serves as a strong signal of potential trend direction; an oscillator above the 50 line typically indicates an uptrend, while one below suggests a downtrend. The Ultimate RSI is particularly adept at reducing the instances of false signals by crossing the midline less frequently than the regular RSI.
For those seeking even more precise signals, monitoring the relationship between the Ultimate RSI and its signal line is crucial. If the Ultimate RSI sits above its signal line, it indicates a strengthening trend, whereas the opposite alignment suggests a weakening trend.
Exploring Smoothing Techniques
The Ultimate RSI offers traders flexibility by allowing them to select from various smoothing methods to tailor their level of analysis. Reactive traders might opt for the higher responsiveness of some methods, while others might prefer the steadiness of smoother outputs. Available options include:
- Exponential Moving Average (EMA)
- Simple Moving Average (SMA)
- Wilder's Moving Average (RMA)
- Triangular Moving Average (TMA)
These methods are ranked by reactivity, with those at the top providing more responsive but less smooth results. Additionally, traders can choose the smoothing method for the signal line, adding further customization to their strategic setup.
Indicator Details
The RSI traditionally delivers a normalized exponential average of price changes between 0 and 100, calculated with the formula:
ema(d) / ema(|d|) × 50 + 50
Here, d represents price changes. To emphasize trends, the Ultimate RSI assigns greater weight to d, particularly as the market hits new highs or lows. This is achieved by substituting d with the rolling range (the period over which higher highs or lower lows are assessed corresponds to the selected length setting).
Indicator Settings
Customize your trading experience with various settings:
- Length: Defines the calculation period of the indicator
- Method: Choose the smoothing method for calculating the indicator
- Source: Select the input source of the indicator
Signal Line Parameters
Further refine your strategy with signal line settings:
- Smooth: Control the degree of smoothness for the signal line
- Method: Determine the smoothing method for calculating the signal line
FAQ
How can I access the Ultimate RSI Indicator?
You can get access on the LuxAlgo Library for charting platforms like TradingView, MetaTrader (MT4/MT5), and NinjaTrader for free.
What are the benefits of using the Ultimate RSI Indicator?
The Ultimate RSI Indicator provides a clearer picture of market trends compared to the regular RSI by reducing noise and emphasizing trend directions, helping traders make more informed decisions.
Why choose different smoothing methods?
Different smoothing methods allow traders to adjust the sensitivity of the indicator to suit their trading style, whether they prefer more reactive or smoother signal lines.
Free indicator
Get free access to this indicator on the platforms below.

The Library is free. Quant makes it yours.
Pull any concept or indicator into Quant: rebuild it, retune it, or turn it into a backtested strategy of your own.