Concept
RSI
RSI, also known as Cutler's RSI, smoothed variants, is a Momentum & Oscillators concept. The Library holds 54 implementations, each one a working definition you can pull into Quant.
Wilder
Top RSI indicators
The top custom implementations, built on the original standard RSI formula.
Any of the 10 RSI implementations below can become a backtested trading strategy — describe your rules and Quant writes the code.
.png&w=3840&q=75)
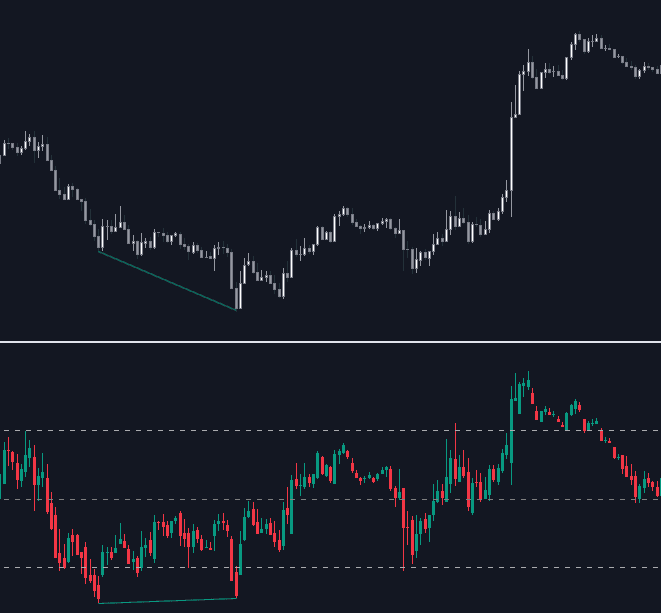
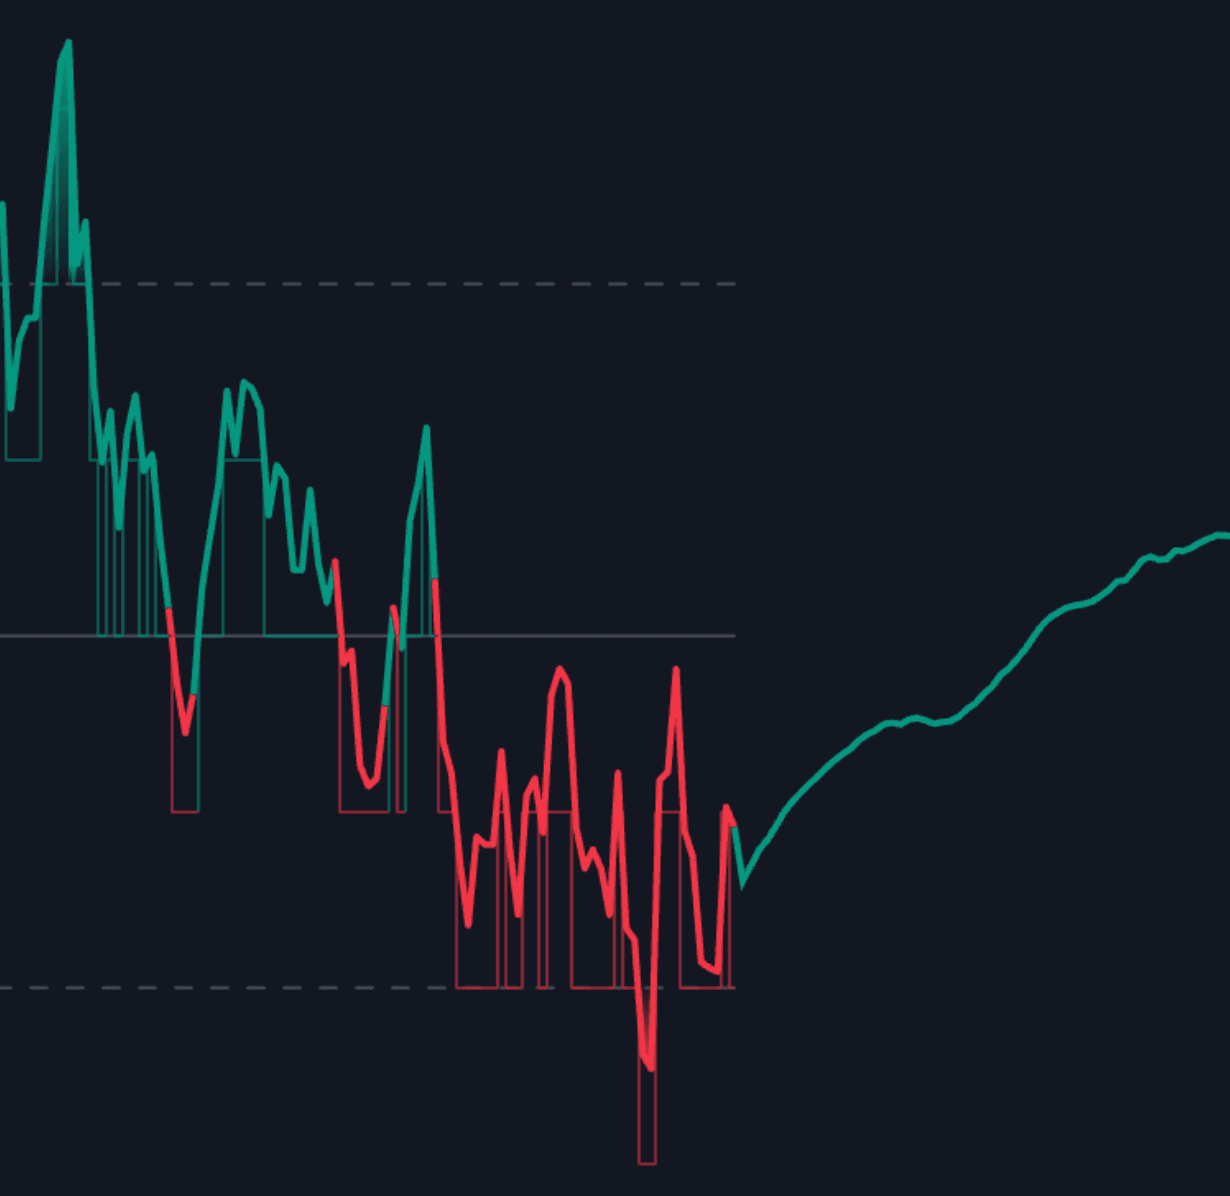
The standard RSI indicator
RSI exactly as classically defined: the faithful reference build of the original formula, free to run in Quant.
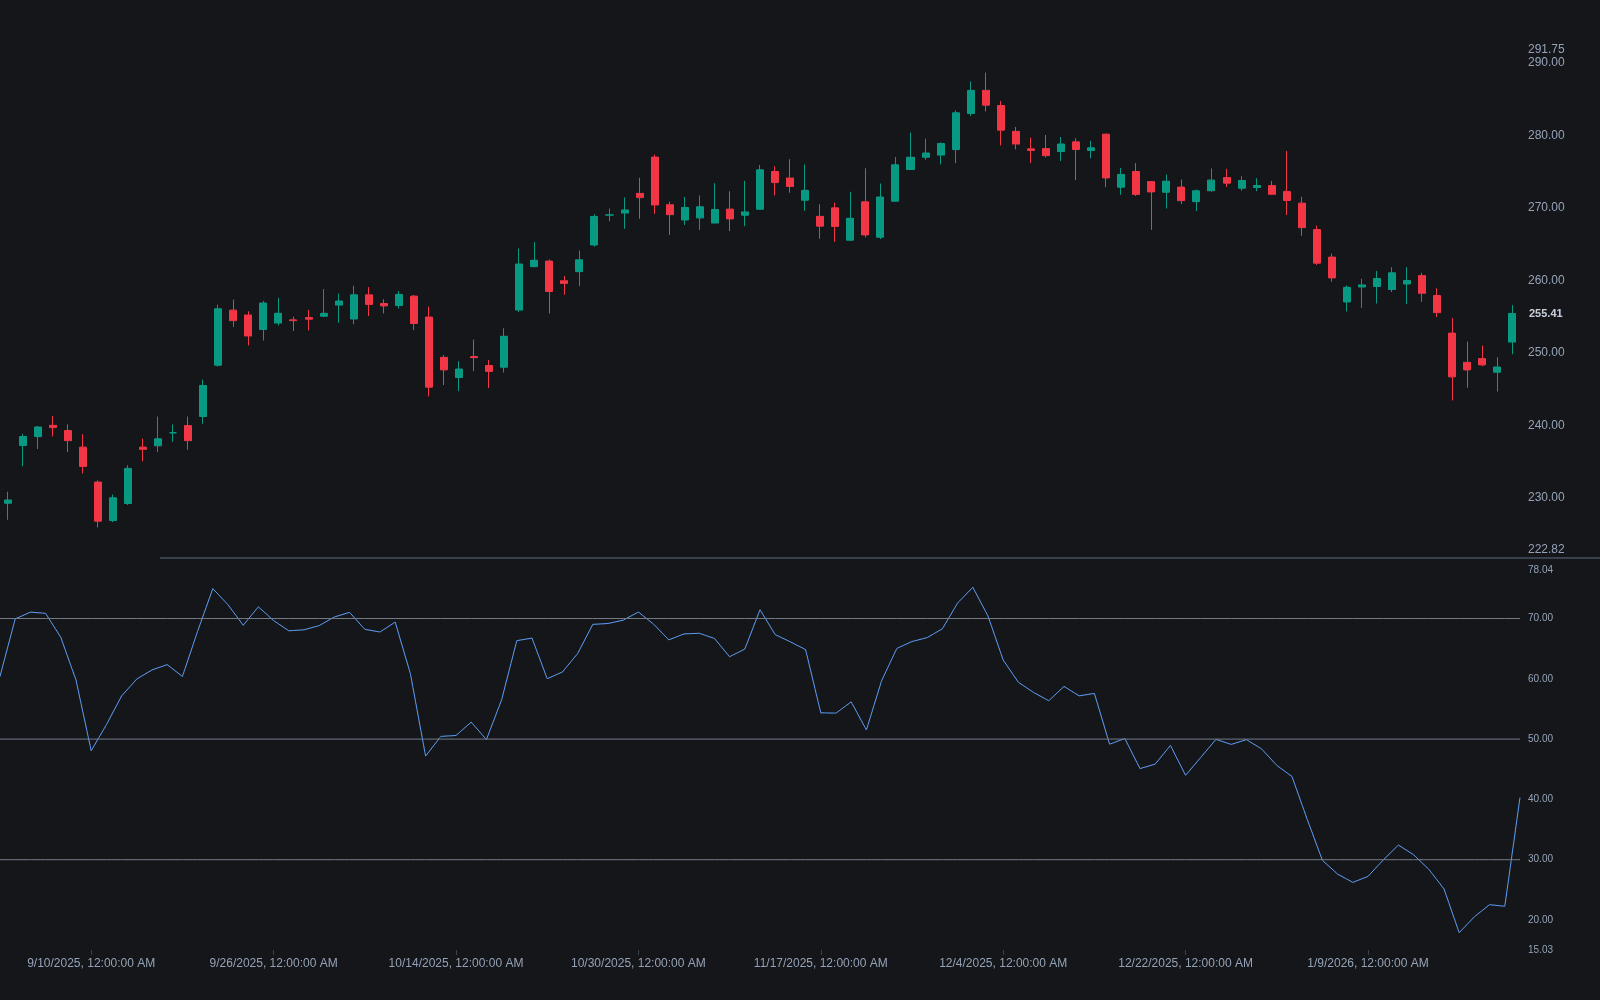
What is RSI?
RSI, the Relative Strength Index, is a bounded momentum oscillator introduced by J. Welles Wilder in his 1978 book New Concepts in Technical Trading Systems. It measures the speed and magnitude of recent price changes by comparing average gains to average losses over a lookback window, 14 periods by default, and maps the result onto a 0-100 scale. When every bar in the window closed higher, the reading approaches 100; when every bar closed lower, it approaches 0.
The conventional grammar: readings above 70 are called overbought, readings below 30 oversold, and the 50 level splits the scale. Wilder's own signals went further: failure swings, where RSI reverses from an extreme and breaks its own pivot without reference to price, and divergence between price extremes and RSI extremes. Later work added range rules: in uptrends RSI tends to hold roughly 40 to 80, in downtrends roughly 20 to 60, so the same number reads differently by regime.
RSI matters because its normalized scale made momentum comparable across any instrument and timeframe, which is why it became one of the most widely used oscillators on charting platforms and the base layer for a family of derivatives, from Stochastic RSI to short-lookback mean-reversion variants. Much of the oscillator vocabulary traders use daily was standardized on RSI first.
How to calculate RSI
RSI is fully specified by a lookback and a smoothing choice; the arithmetic below is Wilder's original.
- 1Separate gains from losses. Over the lookback (14 by default), take each bar's change from the prior close; up moves count toward average gain, down moves (taken as positive numbers) toward average loss.
- 2Smooth with Wilder's method: seed each average with a simple mean, then blend each new bar in at a weight of 1/length (an RMA, an EMA-type recursion with alpha of 1/length). Cutler's variant uses a simple moving average instead, which is why values differ slightly across platforms.
- 3Form the ratio and rescale. RS equals average gain divided by average loss, and RSI equals 100 minus 100/(1 + RS). If the average loss is zero, RSI reads 100.
- 4Read it on the 0-100 scale: 70/30 are the conventional overbought/oversold lines, 50 the momentum midline, and many chartists mark 80/20 for stricter extremes.
How it's calculated
RSI compares the average size of recent gains to recent losses and maps the result onto a 0 to 100 scale.
The smoothing above is Wilder's (RMA), per the original 1978 definition; Cutler's RSI uses simple moving averages of U and D instead, and some platforms offer EMA smoothing, which shifts values slightly.
Equivalently RSI_t = 100 × AvgU_t / (AvgU_t + AvgD_t), which also covers the AvgD_t = 0 case (RSI = 100).
How traders use it
- As a stretch gauge with regime awareness: 70/30 tags are commonly faded in ranges, but in a strong trend RSI can sit above 70 for extended stretches, so an overbought reading is context, not a standalone sell signal.
- For divergence and failure swings: a new price high against a lower RSI high (or the mirror at lows) flags fading momentum, and a failure swing confirms it internally when RSI breaks its own prior pivot.
- As a regime line: crossing and holding either side of 50 marks the centerline regime, and the 40-80 versus 20-60 range rules help classify whether a market is in an uptrend or downtrend leg.
- As raw material: RSI is itself an input to derivative tools (a stochastic applied to RSI, bands drawn on RSI, RSI computed on volume or other sources), and short-lookback versions drive mean-reversion rules.
RSI vs related oscillators
Stochastic Oscillator: Both are bounded 0-100, but the stochastic locates the close within the recent high-low range while RSI compares average gains to average losses. The stochastic is choppier and reaches extremes more readily; RSI moves more slowly and holds trending readings longer.
Stochastic RSI: An oscillator of an oscillator: the stochastic formula applied to RSI values rather than price. It is far more sensitive and pins to 0 or 100 quickly. It measures where RSI sits within its own recent range, which is not the same information RSI gives.
MACD: MACD is an unbounded difference of two EMAs, scaled in price units, so it reads trend direction and strength. RSI is bounded and normalized, so it reads stretch. MACD suits trend confirmation; RSI suits overbought/oversold and divergence work.
Money Flow Index: MFI runs the same ratio-and-rescale construction on volume-weighted money flow instead of close-to-close change. It is often described as a volume-weighted RSI, and the two diverge where volume disagrees with price movement.
More RSI implementations
Concept family
Momentum & Oscillators
91 concepts mapped · 91 in the Library
RSI FAQ
Turn RSI into a trading strategy.
Take any implementation from this page into Quant, then build on it, backtest it on real data, and keep refining it in conversation.