Concept
Adaptive/dynamic RSI
Adaptive/dynamic RSI is a Momentum & Oscillators concept. The Library holds 3 implementations, each one a working definition you can pull into Quant.
Top Adaptive/dynamic RSI indicators
The top custom implementations, built on the original standard Adaptive/dynamic RSI formula.
3 total
From studying Adaptive/dynamic RSI to trading it: take any implementation below into Quant and backtest it instantly.
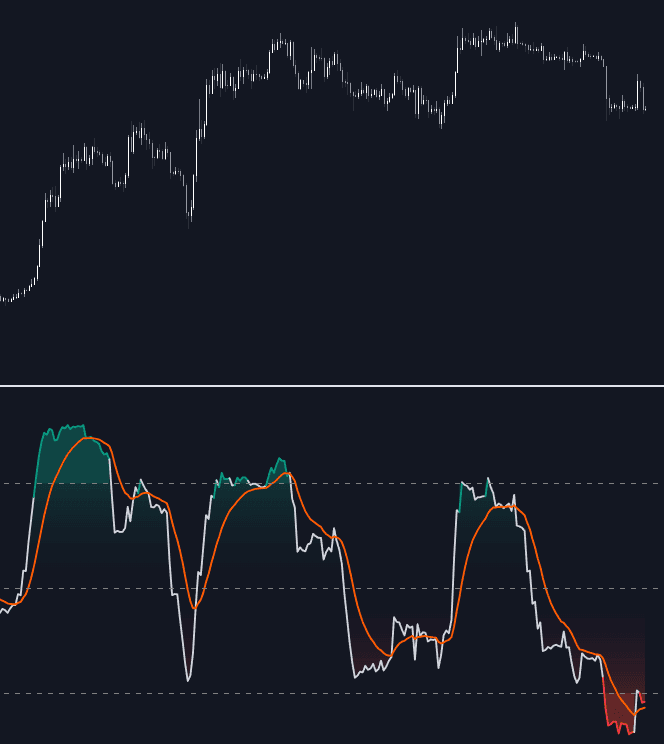
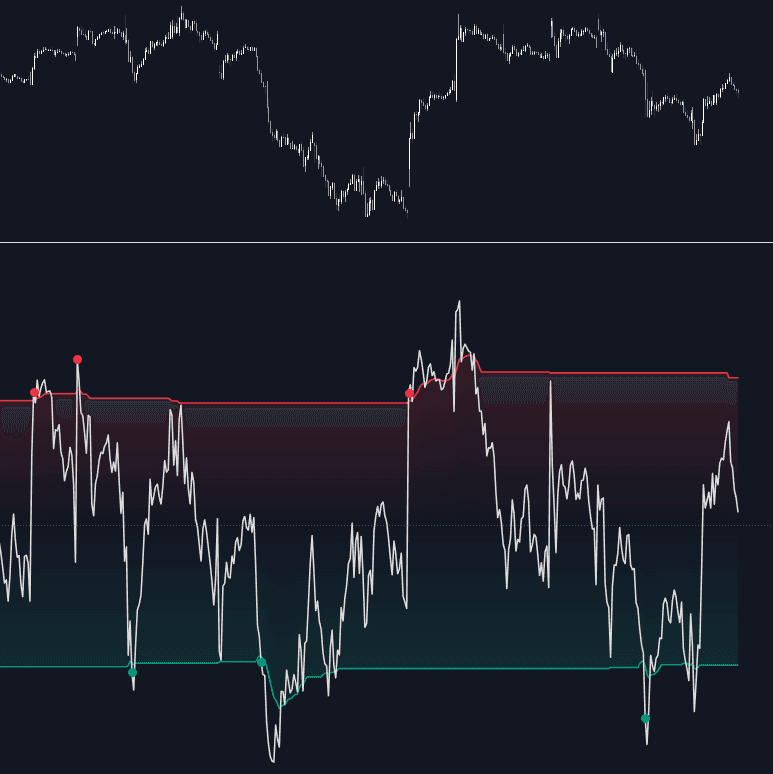
.png&w=3840&q=75)
What is Adaptive/dynamic RSI?
Wilder's RSI runs on three fixed choices: the conventional 14-bar lookback, his own smoothing, and static 70/30 thresholds. Adaptive/dynamic RSI is the umbrella term for modifications that let market data set one or more of those instead. The lookback can be tied to a measured dominant cycle or scaled by an efficiency or volatility reading such as Kaufman's efficiency ratio; the smoothing can be swapped for faster or adaptive averages; and the fixed thresholds can be replaced with bands drawn from the RSI line's own recent distribution.
The approach has roots in the adaptive-indicator wave of the 1990s. Tushar Chande and Stanley Kroll published the dynamic momentum index, an RSI whose lookback contracts as volatility rises; Perry Kaufman's efficiency ratio gave designers a standard trendiness input; and John Ehlers derived lengths from measured cycle periods with signal-processing methods. Applied to Wilder's 1978 oscillator, those threads produced today's adaptive and dynamic RSI family, alongside simpler variants that float only the trigger levels.
The motivation is that no fixed setting suits every regime: a 14-period RSI is sluggish in fast markets and jumpy in quiet ones, and its 70/30 levels are rarely touched in weak trends yet pinned in strong ones. Adaptation attacks that directly, but it is not free. The rules that set the length or the thresholds carry parameters of their own, so tuning moves up a level rather than disappearing, and two charts labeled adaptive RSI can disagree because no single standard construction exists.
Whatever adapts, the output keeps RSI grammar: a bounded scale, extreme zones, centerline behavior, and divergence. Regular divergences and hidden divergences are marked exactly as on the fixed version, with one practical difference: as the effective lookback shifts, the swings that register as comparable extremes shift with it, so adaptive and fixed plots of the same market rarely share a divergence map.
How to read an adaptive RSI on a chart
Before interpreting a single value, establish what the implementation actually adapts.
- 1Check the description and inputs to see which element is dynamic: the lookback, the smoothing, the thresholds, or several at once.
- 2Plot a standard 14-period RSI in a second pane; wherever the two diverge, the adaptation is active, and the comparison shows whether the variant runs faster or slower.
- 3If the thresholds float, read extremes as touches of the bands rather than of 70/30; a band touch means the oscillator is unusually stretched for the current regime.
- 4In strong trends, note how long readings stay pinned near an extreme; adaptation changes the duration of that saturation but does not eliminate it.
How it's calculated
An RSI whose lookback length varies bar by bar, shortening when volatility rises so the oscillator reacts faster in fast markets.
These lines are Chande and Kroll's Dynamic Momentum Index, the standard published dynamic RSI; the gain and loss averages may use simple or Wilder smoothing over TD_t bars.
Other adaptive variants derive the length from a dominant-cycle measurement (Ehlers' adaptive RSI) or use the RSI's distance from 50 as the alpha of an adaptive moving average (ARSI).
Defaults 5, 10, 14 and bounds 5 to 30 follow the original publication.
How traders use it
- As a cycle-tuned oscillator: measure the dominant cycle and set the RSI length to a fraction of it, so the oscillator stays in phase as the market's rhythm shifts instead of drifting out of sync.
- As an efficiency-scaled RSI: shorten the effective lookback when price is moving directionally and lengthen it in chop, keeping responsiveness when it matters and stability when it does not.
- As dynamic overbought/oversold levels: replace 70/30 with rolling bands around the RSI line so an extreme means unusually stretched for the current regime, which keeps signals firing in weak-trend conditions.
- As a drop-in replacement in existing RSI systems, with the honest caveat that changed timing changes the system: signals arrive earlier or later than the fixed version, so backtested behavior does not carry over untested.
- Beyond price: the same adaptations apply when the oscillator runs on volume or another indicator, the practice covered under RSI of other sources, where shifting input character strengthens the case for adaptation.
- As the fast leg of a two-speed pair: an adaptive RSI times entries while a slower gauge such as MACD or momentum arbitrates direction.
Adaptive/dynamic RSI vs fixed alternatives
RSI: The fixed baseline: one lookback, one smoothing, static thresholds. Every adaptive variant is a claim that some of those constants should be variables.
Stochastic RSI: Solves the pinned-thresholds problem differently: instead of adapting RSI itself, it rescales RSI to its own recent range, which makes extremes frequent but also noisier.
Inverse Fisher Transform: Attacks indecisive mid-range readings from the output side: it reshapes oscillator values so they crowd toward the extremes, making signals more binary. Parameters stay fixed; only the response curve changes, and it is often applied to RSI itself.
Concept family
Momentum & Oscillators
91 concepts mapped · 91 in the Library
Adaptive/dynamic RSI FAQ
Turn Adaptive/dynamic RSI into a trading strategy.
Take any implementation from this page into Quant, then build on it, backtest it on real data, and keep refining it in conversation.