Bump-and-Run Reversal
 By LuxAlgoOct 9, 2026
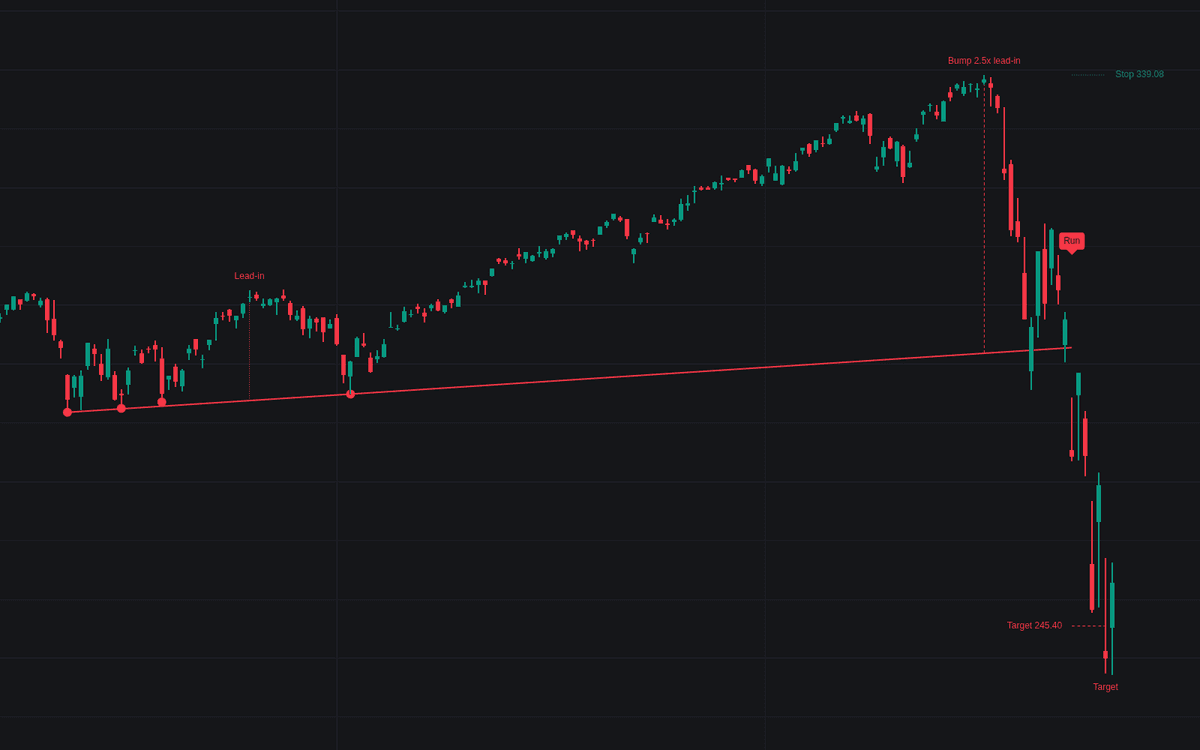

The Bump-and-Run Reversal is a technical analysis pattern designed to identify potential trend reversals following periods of excessive price acceleration. It functions by first establishing a stable lead-in trendline, then detecting a "bump" where price moves away from the trend at an unsustainable speed, and finally signaling a "run" phase when the price breaks back through the initial lead-in line. By isolating these three distinct phases, this indicator helps traders identify speculative blow-off tops or capitulation bottoms, providing a systematic approach to anticipating when an exhausted trend may finally reverse.
How to Trade the Bump-and-Run Reversal?
Trading the pattern involves observing three distinct stages. First, the lead-in phase identifies a stable trend supported by multiple price touches. Second, the bump phase shows a dramatic increase in slope, indicating potential overextension. The final, actionable phase is the run, which occurs when the price closes decisively back through the lead-in trendline.
Traders typically enter a position when the price breaches the lead-in line, confirming the reversal. The indicator provides projected target levels based on the bump's height or the start of the bump, and suggests stop loss placements beyond recent swing extremes to manage risk. It is crucial to monitor the "Closes Back for Failure" setting; if the price reverses and closes back on the original side of the trendline, the pattern is often considered failed, and the position should be re-evaluated.
Bump-and-Run Reversal Settings
Lead-in Trendline
- Swing Length: The number of bars a low or high must dominate to be confirmed as a swing point.
- Minimum Touches: The number of touches required to validate the lead-in trendline.
- Touch Tolerance (ATR): The allowed distance from the trendline for a swing to count as a valid touch, scaled by volatility.
- Lead-in Length (bars): The minimum and maximum number of bars allowed for the lead-in phase.
Bump
- Bump Height (x Lead-in): The minimum vertical distance the price must move above the trendline to qualify as a bump.
- Bump Steepness (x Lead-in Slope): The required increase in the slope of the price advance compared to the lead-in trendline.
- Minimum Bump Height (ATR): The absolute minimum height of a bump to avoid filtering out minor noise.
- Run Window (bars): The time limit after the bump peak for the price to break the trendline before the setup expires.
Run & Trade Levels
- Tops/Bottoms: Toggles for detecting bearish (top) and bullish (bottom) pattern variations.
- Decisive Break Buffer (ATR): The required distance for a close to be considered a legitimate breakout.
- Target: Defines the objective projection, either using the bump height or the level where the bump originated.
- Closes Back for Failure: The number of bars the price must close back on the trendline side to signal a failed pattern.
- Post-Break Watch (bars): The duration the indicator monitors for trade targets and stop exits.
Frequently Asked Questions
Free on Vela
Run it on Vela. Go further with a paid plan.
- Up to 500 strategy alerts, with webhook automation
- Up to 10× the chart history of Free
- Orderflow lookback up to full history
- Up to 100,000 monthly credits for Quant to customize it
- Futures data alongside crypto, stocks, forex and commodities

Run it on Vela. Make it yours with Quant.
Open this indicator free on Vela, our next-generation charting platform. Then ask Quant, our coding agent built into Vela, to retune it or turn it into a backtested strategy of your own.