Fisher Transform
 By LuxAlgoApr 13, 2020
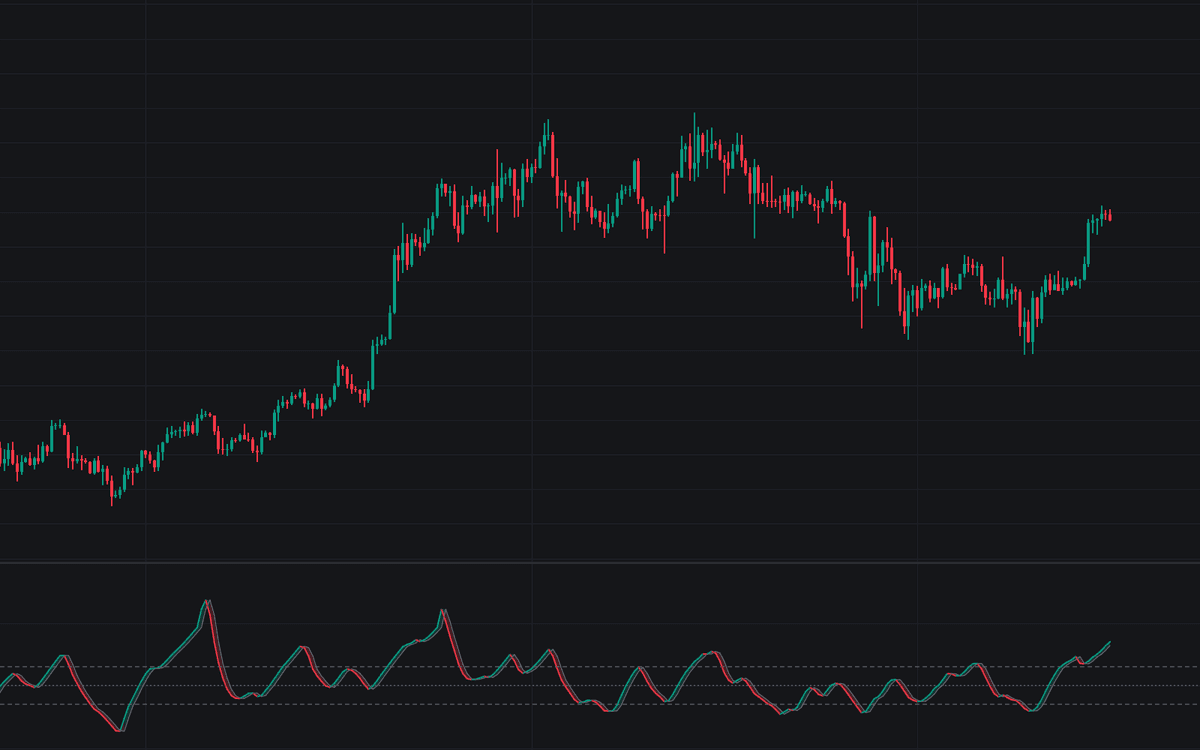

The Fisher Transform normalizes price over a lookback window and applies the inverse hyperbolic tangent, reshaping the result into an oscillator with a near-Gaussian distribution whose turning points print sharply instead of drifting. John Ehlers built it so ordinary readings cluster near zero while genuine extremes stretch far from it, making reversals appear as abrupt slope changes.
This build is the standard raw implementation. The hl2 median price is located within its highest-lowest range over a 9-bar window, smoothed, clamped just short of ±1, and passed through the transform; the Fisher line plots beside its Trigger line (the transform's value delayed one bar), with dashed levels at +1.5 and -1.5 and a dotted zero line.
How to Trade the Fisher Transform?
- Fisher crossing above the Trigger from below -1.5: a sharp turn out of a statistically stretched low, the classic long timing signal.
- Fisher crossing below the Trigger from above +1.5: the mirrored short-side turn out of a stretched high.
- Readings beyond ±1.5: rare territory. Tighten stops or take profits rather than fade automatically.
- Zero-line crosses: the slower directional read; time spent above zero keeps the bias upward.
- Alert coverage: alert conditions ship for bullish and bearish trigger crosses and both zero-cross directions.
The price of speed is chop: crossings come frequently in sideways markets, so most plans gate them with a separate trend or volatility read.
Fisher Transform Settings
- Length (default 9): the lookback locating the hl2 median price within its highest-lowest range. Ehlers' original article used 10; 9 is the common modern default. Raising it calms the line and spaces extremes further apart; lowering it accelerates turns and multiplies crossings.
Frequently Asked Questions

The Library is free. Quant makes it yours.
Pull any concept or indicator into Quant: rebuild it, retune it, or turn it into a backtested strategy of your own.