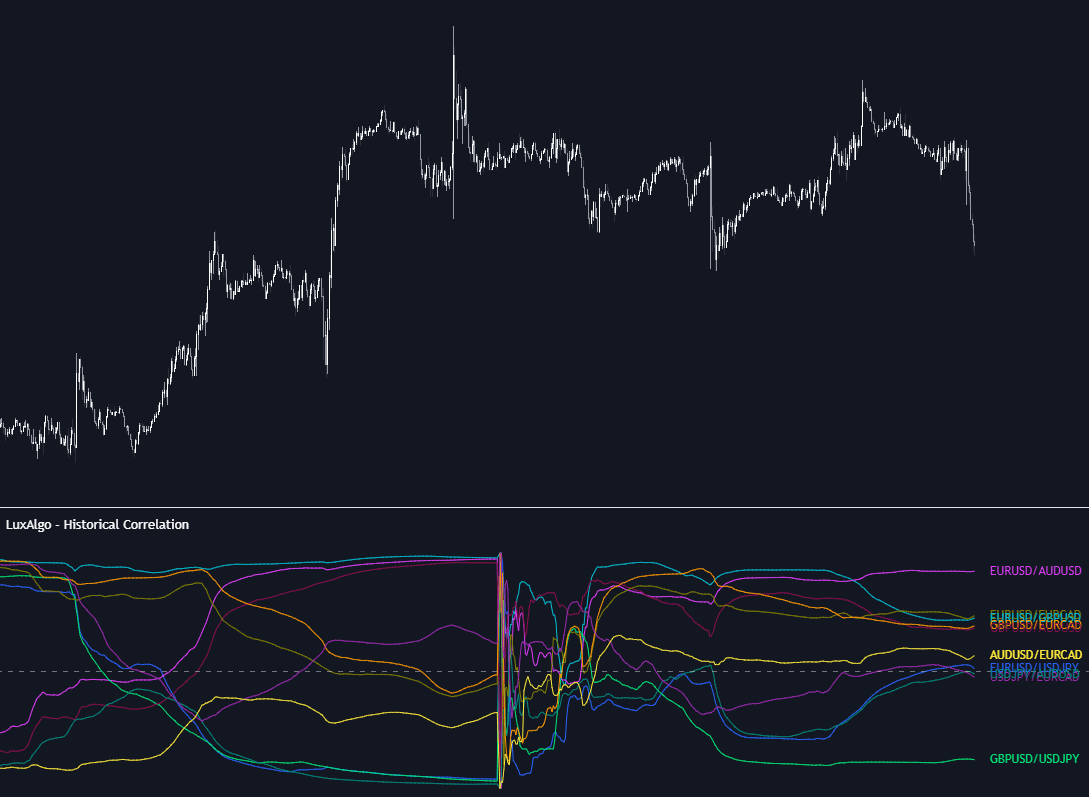
Historical Correlation
By LuxAlgoMar 14, 2024
The Historical Correlation tool is a pivotal resource for traders, providing the historical correlation coefficients of up to 10 user-defined tickers from a specified starting point in time. With versatile display options, users can view historical correlation trends through line graphs or examine the most recent correlation values using a visual heat map.
How to Use the Historical Correlation Tool?
The tool calculates the correlation coefficients, essential metrics that underscore the linear relationship between two assets. These coefficients range from -1 to 1, offering critical insights into asset behavior:
- Positive correlation (Values near +1.0): Indicates synchronous movement—both assets rise and fall together.
- Negative correlation (Values near -1.0): Denotes inverse movement, where one asset's rise corresponds with the other's fall.
- No correlation (Values close to 0): Suggests independent asset movement.
To initiate the tool, users must confirm an anchor point selection, directly on the chart by clicking any bar or through the settings panel date field. For the Anchor period parameter, options include NONE, HOURLY, DAILY, WEEKLY, MONTHLY, QUARTERLY, and YEARLY. Selecting NONE bypasses calculation resets; otherwise, calculations restart at each new period's first bar.
Trading Strategies Using Correlation Coefficients
The correlation coefficient supports numerous trading strategies:
- Pair Trading: Leverage price divergences among highly positively correlated assets to identify buy and sell opportunities, anticipating a reversion to coordinated price movements.
- Sector Rotation: By tracking inter-sector and market-wide correlations, traders may prioritize sectors poised for strong performance in upcoming cycles.
- Diversification: Understanding intra-portfolio correlations helps manage risk. Holding positively correlated assets can intensify risk exposure, whereas uncorrelated assets help mitigate risk.
- Hedging: Use correlated assets to hedge positions—long a negatively correlated asset or short a positively correlated one to offset risk.
Traders can harness historical correlations to better comprehend asset interrelationships, ultimately leading to more informed trading decisions.
The example above illustrates historical correlations across various futures markets. It highlights how Nasdaq100, Dow30, and SP500 remain tightly correlated, while the Euro's correlation with SP500 has notably shifted, reflecting the market's dynamic nature influenced by diverse factors.
Heatmap Display
With heatmap settings enabled, current asset correlations are prominently displayed. Notably:
- EURUSD and GBPUSD show the strongest positive correlation at +90%.
- EURUSD and USDJPY exhibit the lowest negative correlation at -78%.
- AUDUSD and EURCAD have negligible correlation at 1%.
For futures markets, SP500 exhibits low correlation with NaturalGas and the Euro, high positive correlation with Nasdaq100 and Dow20, and strong negative correlation with the Yen, Treasury Bonds, and 10-Year Notes.
In-Depth Settings Overview
Anchor Period Details
This chart with a MONTHLY Anchor Period setting elucidates monthly correlation recalibrations, revealing notable changes such as:
- January saw GBPUSD and USDJPY fluctuate from near perfect negative to zero correlation.
- February's initial -90% GBPUSD and USDJPY correlation decreased to -57%.
- AUDUSD and EURCAD transitioned from a largely negative correlation in the preceding month to a current +53%.
Customizing Your Settings
- Anchor Point: Defines the tool's operational starting point.
- Anchor Period: Resets computations at each new period's outset.
- Ticker Pairs (1-10): Choose ticker pairs, toggle pair visibility, color-code selections, and specify desired correlations.
Crafting the Visual Output
- Drawing Mode: Opt for
LINESto track historical correlations via line graphs orHEATMAPfor a gradient-colored current correlation snapshot.
FAQ
How can I access the Historical Correlation tool? You can get access on the LuxAlgo Library for charting platforms like TradingView, MetaTrader (MT4/MT5), and NinjaTrader for free.
What is the importance of the Anchor Period? The Anchor Period allows users to define specific timeframes for recalibrating correlation calculations, ensuring that the data aligns with temporal market conditions.
What trading strategies can benefit from correlation analysis? Strategies like Pair Trading, Sector Rotation, Diversification, and Hedging can all leverage correlation insights to optimize trade decisions and manage risk effectively.
Free indicator
Get free access to this indicator on the platforms below.
The Library is free. Quant makes it yours.
Pull any concept or indicator into Quant: rebuild it, retune it, or turn it into a backtested strategy of your own.