Normality Testing
 By LuxAlgoAug 9, 2026
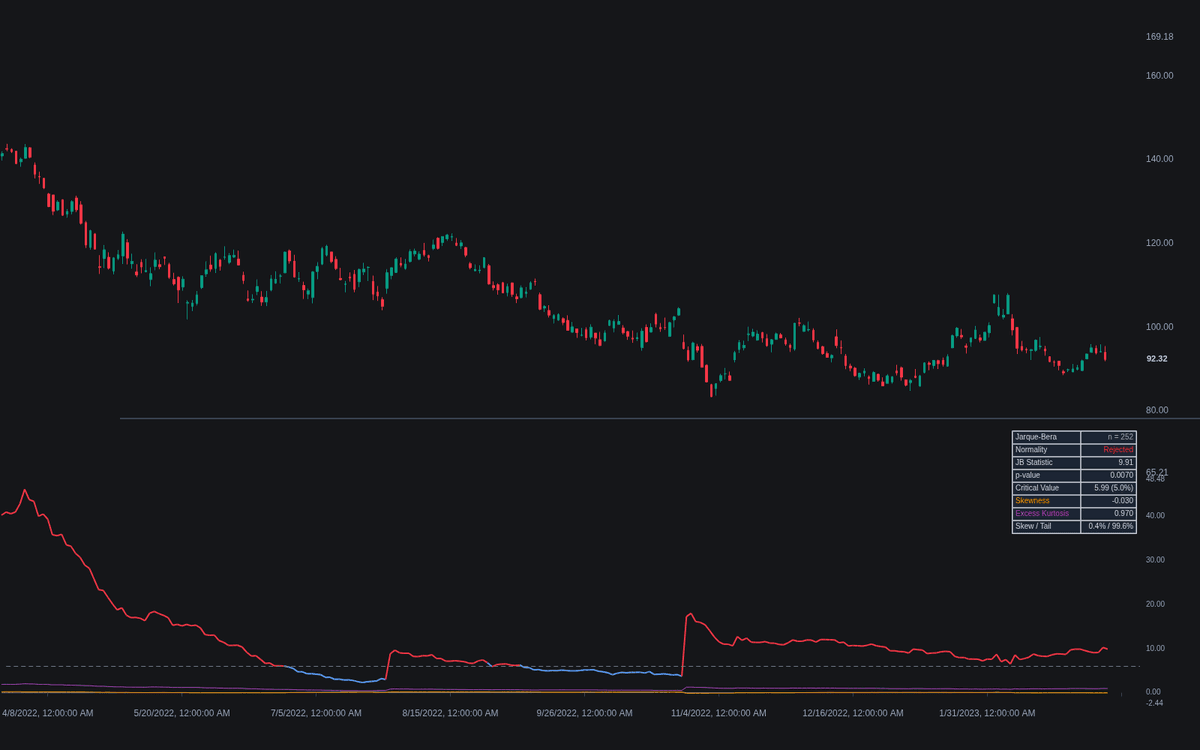
Normality Testing keeps a live answer to a question most quantitative tools quietly assume away: could this return series plausibly be Gaussian? The build maintains a rolling sample of the source's log returns, percent returns or raw values, computes the Jarque-Bera statistic from the sample's skewness and excess kurtosis, and plots it against its chi-squared critical value — the standard machinery of normality testing run continuously instead of once. The line wears the verdict color and the pane background tints wherever normality is rejected.
How to Trade the Normality Testing?
- Statistic above the dashed critical value: normality rejected — z-scores, standard-deviation bands and other Gaussian tail math understate extreme moves on this sample, by more the higher the statistic sits.
- Skew / Tail split: the dashboard shows how much of the statistic comes from asymmetry versus fat tails, and the optional component plots separate the two sources on the pane.
- Verdict transitions: alerts fire when the statistic crosses its critical value in either direction — a regime flag for parametric models elsewhere.
Normality Testing Settings
- Source (default close): the series under test.
- Test Series (default Log Returns): transformation applied first; Percent Returns and Raw Source are the alternatives, the latter for series that are already returns or residuals.
- Sample Size (default 252): observations in the rolling sample — one trading year of daily bars.
- Significance Level % (default 5.0): the rejection threshold; the critical value equals -2 ln(alpha), about 5.99 at 5%.
- Show Dashboard (on, Top Right, Small) plus Gradient Fill (on), Highlight Rejection Background (on) and Show Skew/Tail Components (off).
Frequently Asked Questions
How does this relate to the Distribution Moments indicator?
Distribution Moments plots the moments themselves as rolling series. This build compresses the third and fourth of them into a single formal test with a critical value and a p-value — trading detail for a clean reject / not-reject verdict.
What sample size should I use?
The 252 default is one year of daily bars. Small samples miss real departures while very large ones reject even trivial ones, which is why the dashboard shows skewness and excess kurtosis beside the verdict — read the magnitudes, not just the rejection.
Does a rejection mean I should stop using standard-deviation tools?
No — it calibrates them. Rejection says the Gaussian tail probabilities are wrong for this series, usually too thin, so treat multi-sigma readings as more common than textbook odds suggest.

The Library is free. Quant makes it yours.
Pull any concept or indicator into Quant: rebuild it, retune it, or turn it into a backtested strategy of your own.