Concept
Normality Testing
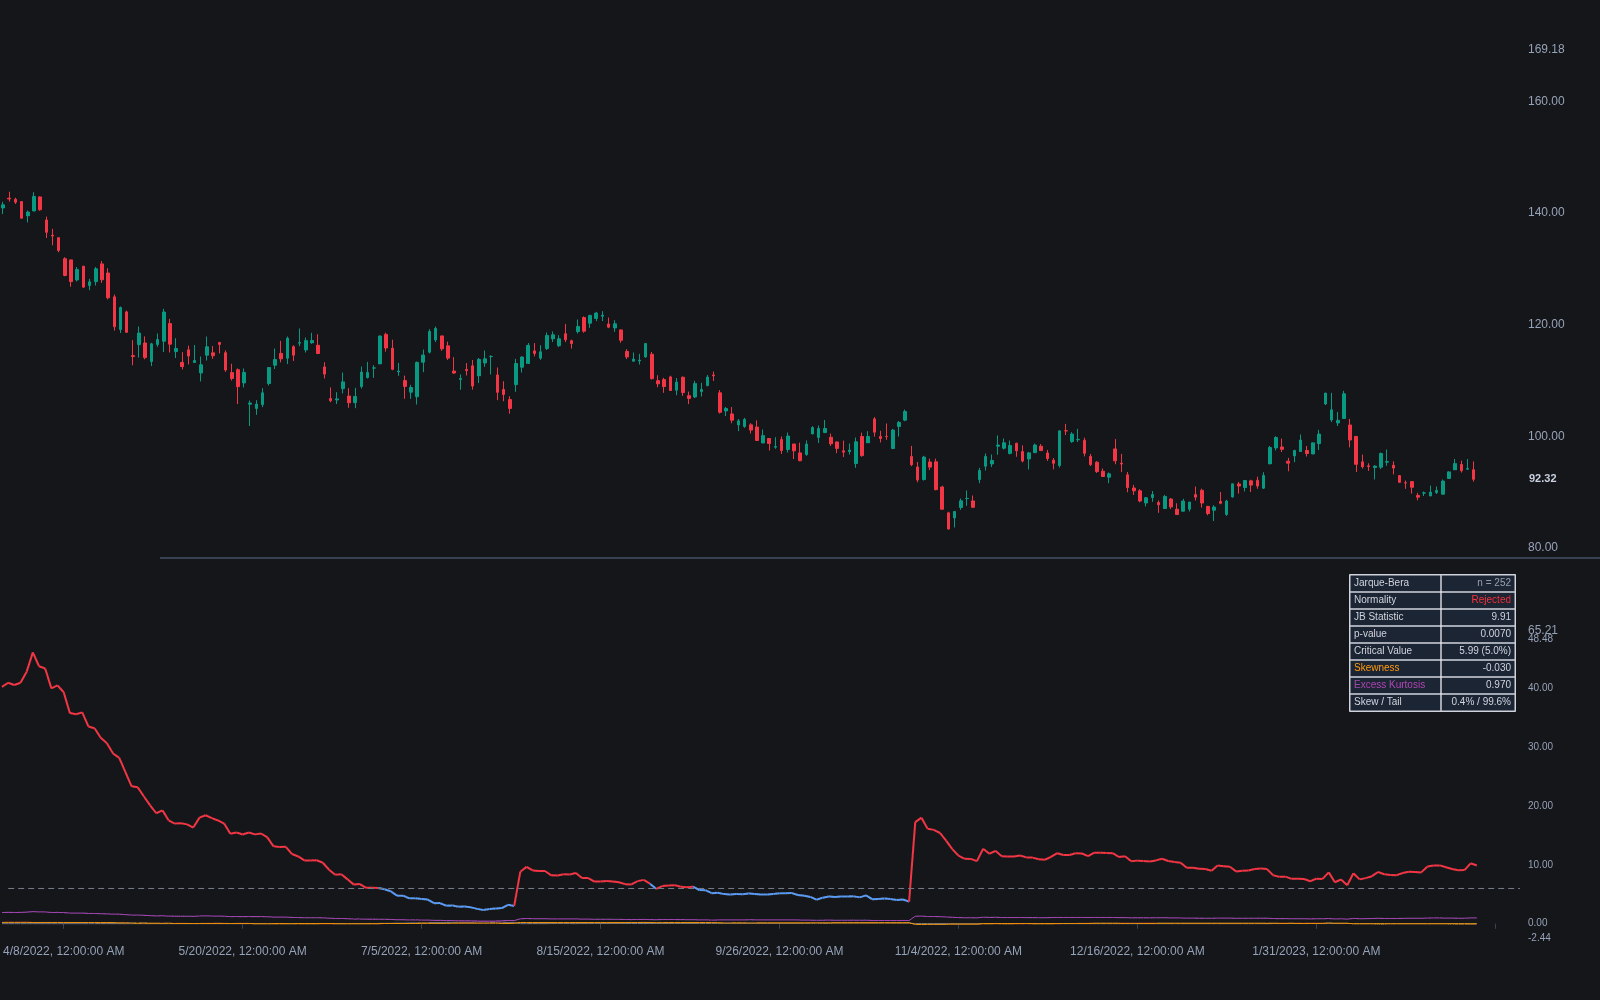
Normality Testing, also known as Jarque-Bera, is a Statistics concept. The Library holds 1 implementation, a working definition you can pull into Quant.
Top Normality Testing indicator
The top custom implementation, built on the original standard Normality Testing formula.
1 total
Want to trade Normality Testing? The implementation below is one prompt away from a backtested strategy in Quant.
What is normality testing?
Normality testing asks a blunt statistical question of a return series: is it plausible that these observations came from a normal (Gaussian) distribution? Formal tests such as Jarque-Bera, Shapiro-Wilk, Anderson-Darling, and Kolmogorov-Smirnov each compare some feature of the sample against what a normal distribution would produce, and return a statistic with a p-value. The Jarque-Bera test is the most common in finance because it works directly from skewness and kurtosis, the third and fourth of the distribution moments.
Traders care because a large amount of everyday quantitative machinery quietly assumes normality: z-score thresholds, standard-deviation bands, parametric value-at-risk, confidence intervals on backtest returns. Asset returns are famously non-normal, with fat tails and, for equities, usually negative skew, and the failure grows more severe at higher frequencies. Daily returns almost always reject normality decisively; monthly and quarterly returns come closer but still often fail. A normality test turns that folklore into a measured fact about the specific series in hand.
In practice the test is less a gatekeeper than a calibration tool. Rejecting normality does not forbid using Gaussian-based tools; it tells you how far their tail probabilities will be from reality. A 4-sigma daily move should appear only about once in several decades under the normal distribution, yet real markets produce them far more often, and the size of the Jarque-Bera statistic gives a rough sense of how much of that gap comes from skew versus tails. Visual companions such as Q-Q plots and kernel density estimation show where the departure lives rather than just that it exists.
How it's calculated
The Jarque-Bera statistic, the standard normality test in finance:
Large JB values reject normality; as a rough guide, values above about 6 reject at the 5 percent level for large n.
Shapiro-Wilk tends to have better power in small samples; Anderson-Darling weights the tails more heavily, which suits financial data.
How traders use it
- Risk-model sanity checks: before trusting parametric VaR, standard-deviation stops, or Gaussian position-sizing math, traders test the return series and widen tail assumptions when normality is rejected, which it usually is at daily and intraday frequencies.
- Backtest inference: significance of returns calculations that rely on t-statistics assume approximate normality of the sampling distribution; heavy tails and serial dependence weaken that, pushing practitioners toward bootstrap and permutation approaches instead.
- Choosing simulation inputs: whether Monte Carlo price paths can use Gaussian innovations or need fat-tailed alternatives (such as Student-t) is exactly the question a normality test answers for the data at hand.
- Profiling and regime work: as part of distribution-of-returns profiling, tracking rolling skewness and kurtosis shows when the distribution's shape is drifting, which matters more for trading decisions than a single full-sample verdict.
- A key limitation: with large samples these tests reject even trivially small departures from normality, and with small samples they miss large ones, so the effect size matters more than the p-value.
Concept family
Statistics
46 concepts mapped · 46 in the Library
Normality Testing FAQ
Turn Normality Testing into a trading strategy.
Take the implementation from this page into Quant, then build on it, backtest it on real data, and keep refining it in conversation.