Distribution Moments
 By LuxAlgoMay 19, 2026
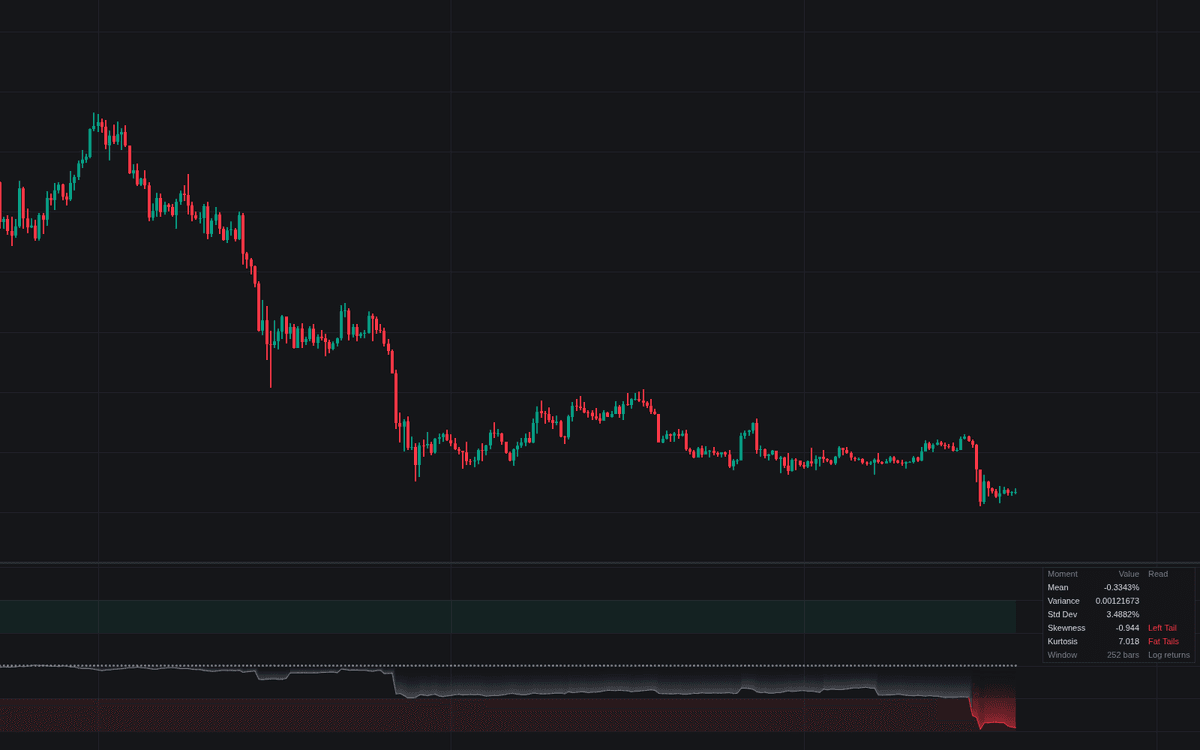

Distribution Moments turns a rolling window of returns into the numbers that describe its shape (mean, variance and standard deviation, skewness, and kurtosis), plotting one of them in the pane while a dashboard reports them all. Built as the reference implementation of distribution moments for charts, it computes log returns of the close over 252 bars by default, plots skewness against a dotted reference level, and fires alerts when asymmetry or tail weight crosses your thresholds.
How to Trade the Distribution Moments?
- Skewness at or below -0.5: the dashboard flags Left Tail (recent surprises lean downside); readings at or above +0.5 flag Right Tail.
- Kurtosis above 3: heavier tails than the normal benchmark, an argument for wider stops and smaller size.
- Std Dev row: per-bar return dispersion, the scale the shape numbers are standardized by.
- Regime drift: watch the plotted moment's trend rather than single prints. Return shape tells you how far to trust the other statistical tools.
Distribution Moments Settings
- Source (default close): series the return sample is built from.
- Return Type (default Log): log returns are standard; Simple for comparison.
- Window Length (default 252): returns in the rolling sample. Higher moments want hundreds of observations.
- Plotted Moment (default Skewness): which of the five series the pane displays.
- Kurtosis Convention (default Raw (Normal = 3)): Raw benchmarks normal at 3; Excess subtracts that 3.
- Skewness Alert Threshold (default 0.5): absolute level for the tail alerts and dashboard read.
- Kurtosis Alert Threshold (default 3.0): raw kurtosis level marking fat tails.
- Show Dashboard (default enabled) and Gradient Fill (default enabled) round out the pane.
Frequently Asked Questions

Original indicatorBuilt in-house by LuxAlgo
The Library is free. Quant makes it yours.
Pull any concept or indicator into Quant: rebuild it, retune it, or turn it into a backtested strategy of your own.