Put/call Ratio
 By LuxAlgoApr 4, 2026
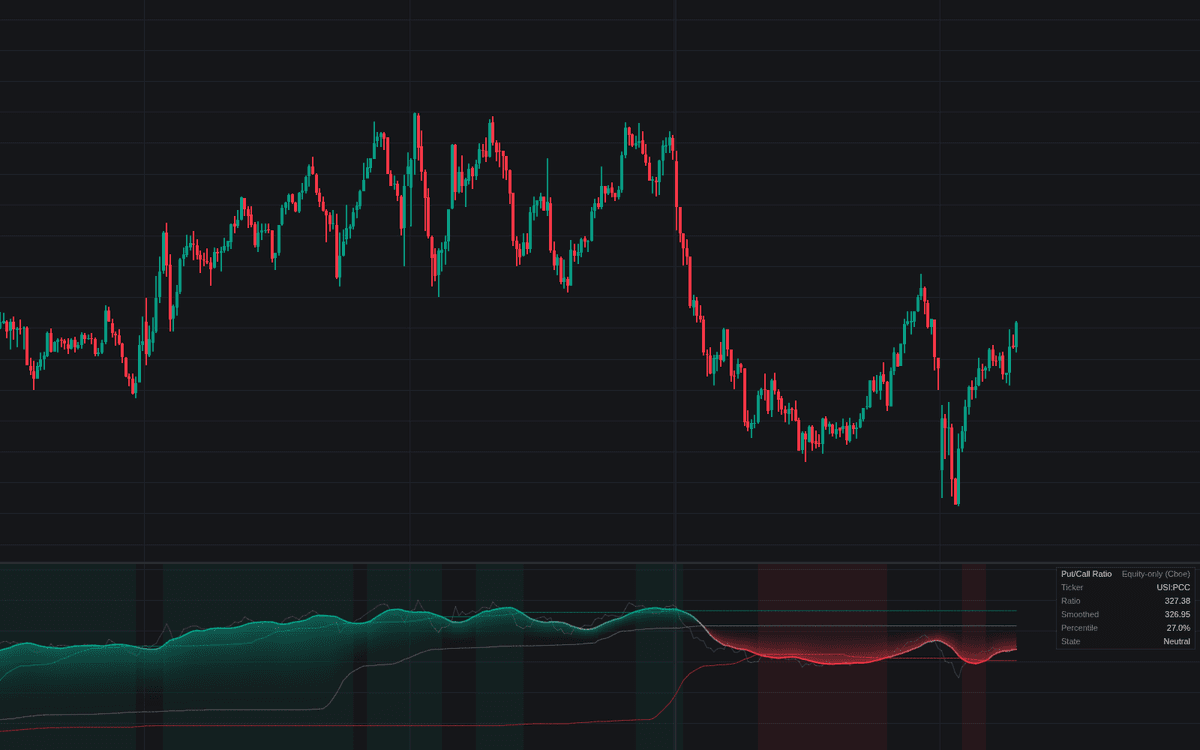

Put/call Ratio brings the classic options-sentiment gauge onto the chart as a self-calibrating series: raw put/call ratio prints appear as a faint context line, a 10-period simple average smooths them into a readable swing, and the smoothed line is ranked against its own rolling 252-bar distribution. Extremes are percentile-based rather than fixed (the 90th percentile marks the fear band, the 10th the complacency band), so the read adapts as typical levels drift, and the line's color slides with its percentile rank.
How to Trade the Put/call Ratio?
- Smoothed ratio above the fear band: put activity is unusually heavy (crowd fear, treated as contrarian bullish). Extremes can extend, so most frameworks wait for price confirmation.
- Smoothed ratio below the complacency band: unusually light put demand (speculative appetite, a contrarian bearish warning).
- Exit from an extreme: the fall back inside the bands is what the exit alerts capture; background highlights shade the pane while an extreme holds.
A dashboard reports the selected series, latest readings, percentile rank, and sentiment state.
Put/call Ratio Settings
- Ratio Series (default Equity-only (Cboe)): equity-only, index, total, or Custom via your own ticker.
- Equity-only / Index / Total / Custom Ticker (defaults USI:PCC, USI:PCI, USI:PC, USI:PCC).
- Data Timeframe (default D): higher-timeframe data is requested on confirmed bars only, so values do not repaint.
- Smoothing (default SMA, length 10): the average applied to the raw ratio.
- Rolling Window (default 252): the ranking lookback, roughly one trading year.
- Extreme Percentiles (defaults 90 and 10): the band levels.
- Style and dashboard toggles cover the raw line, bands and median, gradient fill, extreme highlights, and placement.
Frequently Asked Questions

The Library is free. Quant makes it yours.
Pull any concept or indicator into Quant: rebuild it, retune it, or turn it into a backtested strategy of your own.