Volatility Regime Classification
 By LuxAlgoOct 9, 2026
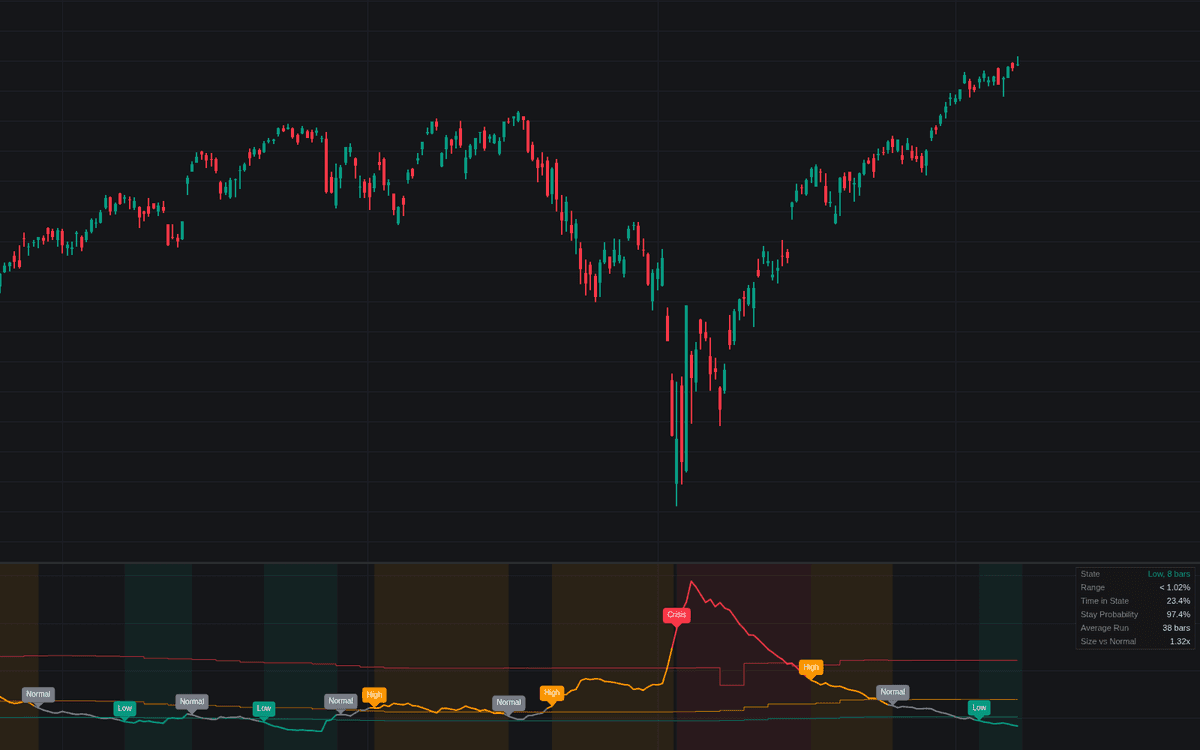

Volatility Regime Classification categorizes current market volatility into distinct regimes using dynamic, data-driven thresholds. By applying a one-dimensional k-means clustering approach on chosen volatility measures, it identifies periods of low, normal, high, or crisis-level volatility. This tool helps traders adapt their strategies to different market environments by quantifying the volatility context relative to recent historical performance, rather than relying on arbitrary fixed boundaries that may not apply to every asset.
How to Trade the Volatility Regime Classification?
Trading based on regimes allows for dynamic position sizing and strategy selection based on the current market environment. In Low volatility regimes, price action is often compressed, which may suggest potential breakout opportunities or the use of range-bound strategies. Conversely, High or Crisis volatility regimes indicate erratic movement where risk management is paramount. During these periods, many traders choose to reduce exposure or tighten stop-loss orders to account for wider price swings.
The dashboard provides essential statistics on how long regimes typically last and the current persistence of the volatility state, helping traders gauge whether the current environment is likely to continue or if a transition is occurring. Users can monitor the boundaries plotted on the chart to identify structural shifts in market volatility. By observing when the price-based volatility crosses these learned boundaries, you can align your entry and exit criteria with the market's current psychological and structural state.
Volatility Regime Classification Settings
Volatility Measure
- Measure: Selects between ATR %, Realized Volatility, or Bollinger BandWidth as the source for classification.
- Length: Sets the lookback period used for the volatility calculation.
- Periods per Year: Adjusts the annualization factor for Realized Volatility based on the market timeframe.
Data-Drawn Boundaries
- Training Window: Defines how many historical bars are used to learn the state boundaries.
- Minimum History: Sets the threshold of historical bars required before the first classification fit.
- Crisis Tier: Enables a fourth state above the High state to capture extreme market stress.
- Refit Every: Controls how frequently the algorithm recalculates boundaries as new data arrives.
- Passes per Refit: Adjusts the computational effort used during each cluster update.
State Stability
- Hysteresis: Defines the buffer around boundaries to prevent rapid or unnecessary flipping between states.
- Confirmation Bars: Sets the required number of consecutive bars a new state must hold before the indicator officially commits to a switch.
Style
- Boundaries: Toggles the visibility of lines separating the different volatility states.
- State Background: Toggles the background tinting for each detected regime.
- State Change Labels: Displays text markers when the volatility regime transitions.
Dashboard
- Show Dashboard: Enables an on-screen table displaying statistical details about regimes.
- Detail: Toggles between showing only the current state or a table for all states.
- Position/Size: Adjusts the screen layout and text scale of the dashboard overlay.
Frequently Asked Questions
Free on Vela
Run it on Vela. Go further with a paid plan.
- Up to 500 strategy alerts, with webhook automation
- Up to 10× the chart history of Free
- Orderflow lookback up to full history
- Up to 100,000 monthly credits for Quant to customize it
- Futures data alongside crypto, stocks, forex and commodities

Run it on Vela. Make it yours with Quant.
Open this indicator free on Vela, our next-generation charting platform. Then ask Quant, our coding agent built into Vela, to retune it or turn it into a backtested strategy of your own.