Winsorization
 By LuxAlgoJun 19, 2026
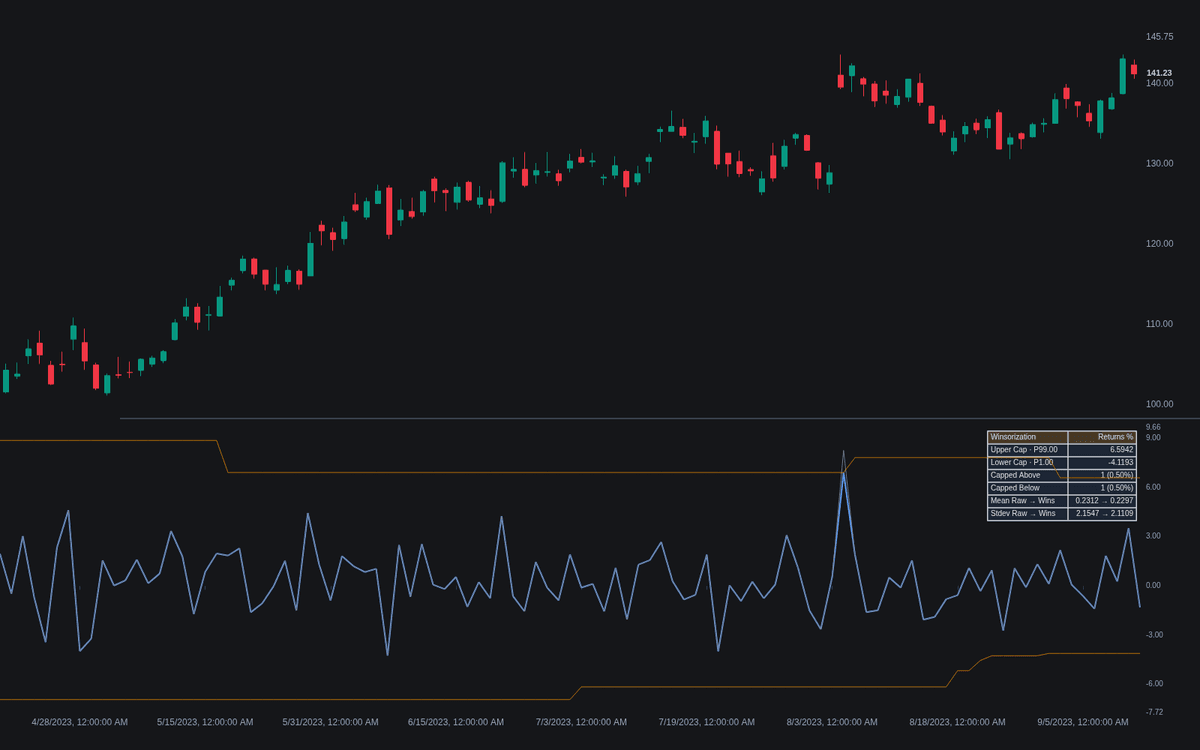
Winsorization turns the robust-statistics treatment into a live series: every observation beyond a rolling percentile cap is replaced with the cap value — winsorization, implemented faithfully on the chart for the first time. The winsorized series plots beside the raw one inside the cap corridor, capped bars fill the gap between print and replacement so the clipped magnitude stays visible, and the dashboard quantifies the effect: cap levels, capped counts per tail, and mean and standard deviation before and after.
How to Trade the Winsorization?
- A robust read: the winsorized line is what a mean, spread or model would see once single extreme prints stop dominating — the raw overlay shows what was tamed.
- Cap hits: an exceedance is information; alerts fire on upper, lower or any cap hit, and the highlighted excess shows how far past the corridor the print went.
- Dashboard deltas: the raw-to-winsorized shift in mean and standard deviation measures how much the tails were steering the statistics.
Winsorization Settings
- Data (default Returns %): winsorize the raw Source, its percent or log returns, or Volume.
- Source (default close): price series for the source and returns modes.
- Percentile Lookback (default 200): window estimating the caps; tail percentiles need a large sample.
- Lower Percentile (default 1) and Upper Percentile (default 99): the cap pair; 5/95 caps five percent per tail.
- Percentile Method (default Linear Interpolation): interpolate between ranks like most statistics packages, or snap to Nearest Rank.
- Past Data Only (No Lookahead) (default on): caps come from the window ending on the previous bar, so no observation influences its own cap.
- Display: Raw, Caps, Corridor Fill, Highlight Capped Excess (all on), Cap Markers (off), Show Dashboard (on).
Frequently Asked Questions
Why cap by percentile instead of standard deviations?
A Standard Deviation computed on raw data is itself inflated by the outliers being judged, so sigma-based clipping moves its own goalposts. Percentile caps depend only on rank order — hence their status as the standard robust treatment.
What does Past Data Only actually change?
Enabled, each bar's caps come from the window ending one bar earlier — mirroring live use, where today's print cannot set today's threshold. Disabled, the current observation joins its own cap estimate.
Is winsorizing the same as deleting outliers?
No. Trimming drops tail observations and shrinks the sample; winsorizing replaces them with the cap value — the count is unchanged and the extreme still registers with its sign, minus its leverage.

The Library is free. Quant makes it yours.
Pull any concept or indicator into Quant: rebuild it, retune it, or turn it into a backtested strategy of your own.