Concept
Winsorization
Winsorization is a Statistics concept. The Library holds 1 implementation, a working definition you can pull into Quant.
Top Winsorization indicator
The top custom implementation, built on the original standard Winsorization formula.
1 total
Want to trade Winsorization? The implementation below is one prompt away from a backtested strategy in Quant.
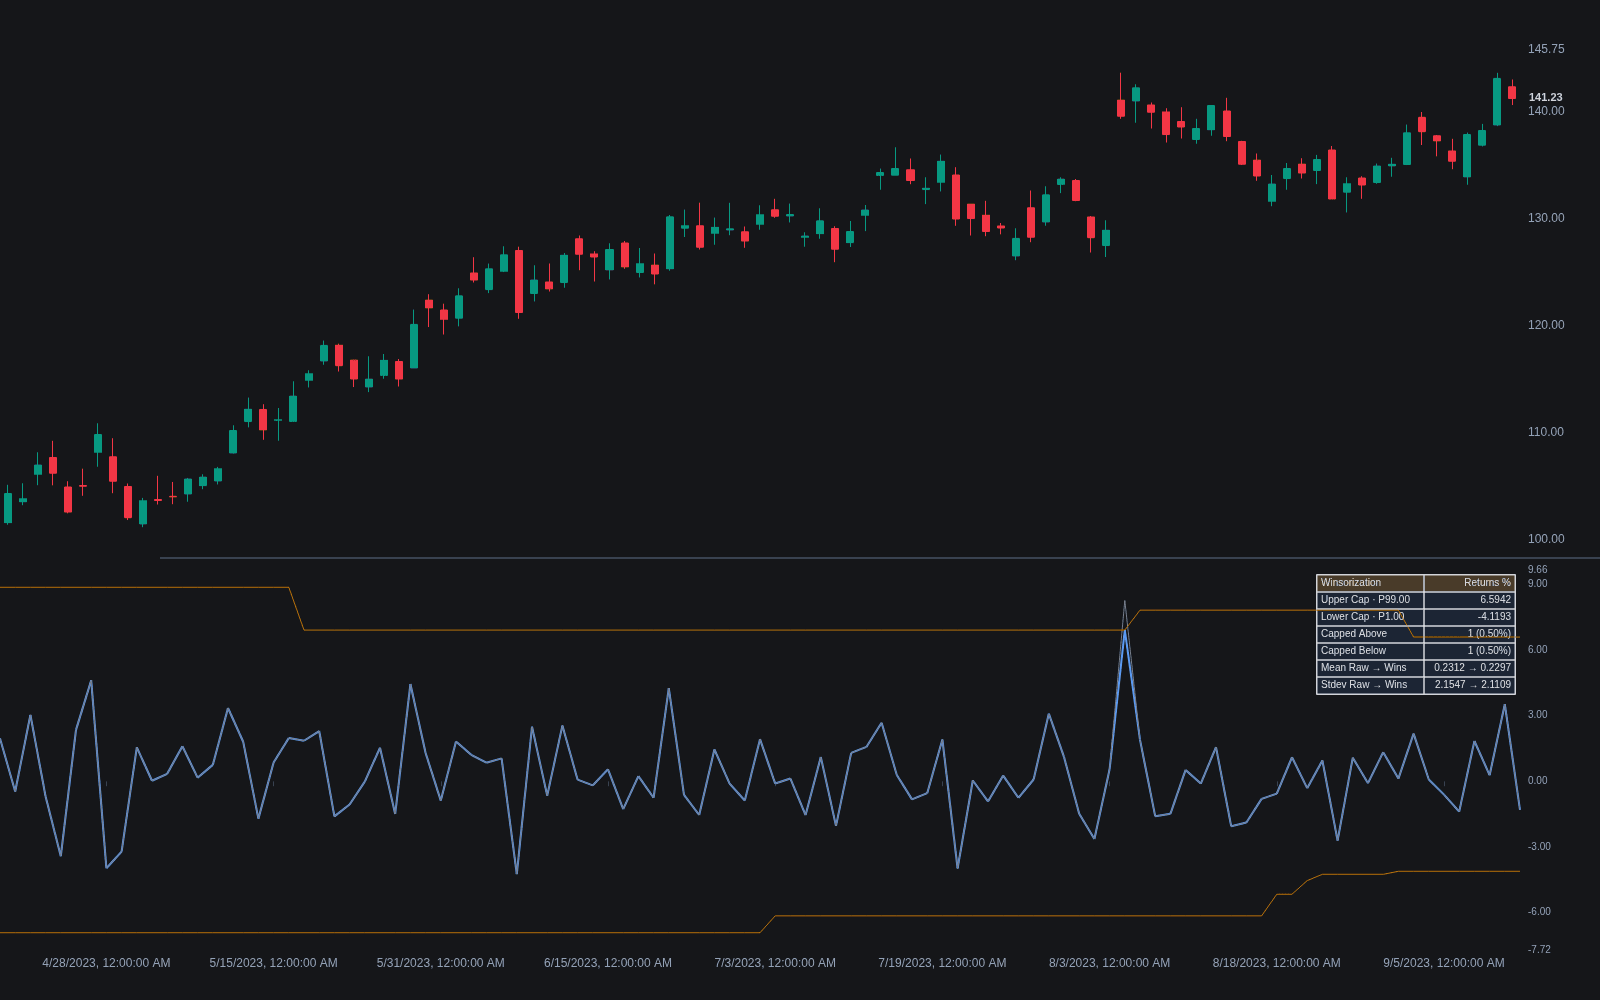
What is winsorization?
Winsorization is a technique for limiting the influence of extreme values in a data set: instead of deleting outliers, every value beyond a chosen percentile is replaced with the value at that percentile. Winsorizing at the 1st and 99th percentiles, for example, sets everything below the 1st percentile equal to the 1st-percentile value and everything above the 99th equal to the 99th-percentile value. The name honors the statistician Charles P. Winsor, and the method is a standard tool of robust statistics.
The motivation in trading is that financial data is full of legitimate but disruptive extremes: crash days, short squeezes, data errors, illiquid prints. A single such observation can dominate a mean, inflate a standard deviation, or let one training example steer a fitted model. Winsorization tames the extreme without pretending it never happened; the observation stays in the sample at a capped magnitude, preserving sample size and the direction of the surprise.
The essential distinction is from trimming, which deletes the tail observations entirely, and from filtering flagged points via outlier detection. Winsorization keeps every row, which matters for time series where dropping bars breaks the sequence. The honest cost is bias: the winsorized mean and variance systematically understate tail risk, so the technique belongs in estimation and feature preparation, never in risk measurement, where the tails are precisely the point.
How it's calculated
Winsorization at lower percentile p_low and upper percentile p_high:
A '90 percent winsorization' caps 5 percent in each tail.
In rolling or live use, percentiles must be computed from past data only; using full-sample percentiles leaks future information into historical rows.
How traders use it
- Feature preparation: quantitative researchers routinely winsorize inputs during feature engineering, commonly at the 1st and 99th percentiles, so that a handful of extreme rows cannot dominate a regression or machine-learning fit.
- Robust indicator inputs: winsorizing returns or volume before computing rolling statistics stops a single crash bar from distorting a z-score or volatility estimate for the entire lookback window that contains it.
- Cross-sectional factor work: in ranking stocks by valuation or momentum metrics, winsorizing each metric per date is standard practice so that one degenerate value (a near-zero denominator, a data glitch) does not stretch the whole scale.
- Backtest diagnostics: comparing a strategy's results on raw versus winsorized returns reveals how much of the edge lives in a few extreme days, a useful robustness-testing exercise, though the raw results remain the true record.
- Its main limitation: cap levels are a researcher choice, and aggressive winsorization can erase real signal, especially in strategies whose profits come specifically from tail events.
Winsorization vs related concepts
Outlier Detection: Outlier detection decides which points are anomalous; winsorization is one possible treatment once they are found, and it can also be applied blindly by percentile without any detection step.
Min-Max Scaling: Min-max scaling rescales all values into a fixed range using the extremes themselves, so outliers control the transformation; winsorization does the opposite, capping the extremes so they cannot.
Percentile Rank: Percentile ranking replaces every value with its rank position, discarding magnitude information entirely; winsorization preserves magnitudes for the central mass and compresses only the tails.
Concept family
Statistics
46 concepts mapped · 46 in the Library
Winsorization FAQ
Turn Winsorization into a trading strategy.
Take the implementation from this page into Quant, then build on it, backtest it on real data, and keep refining it in conversation.