Standard Deviation
 By LuxAlgoApr 13, 2020
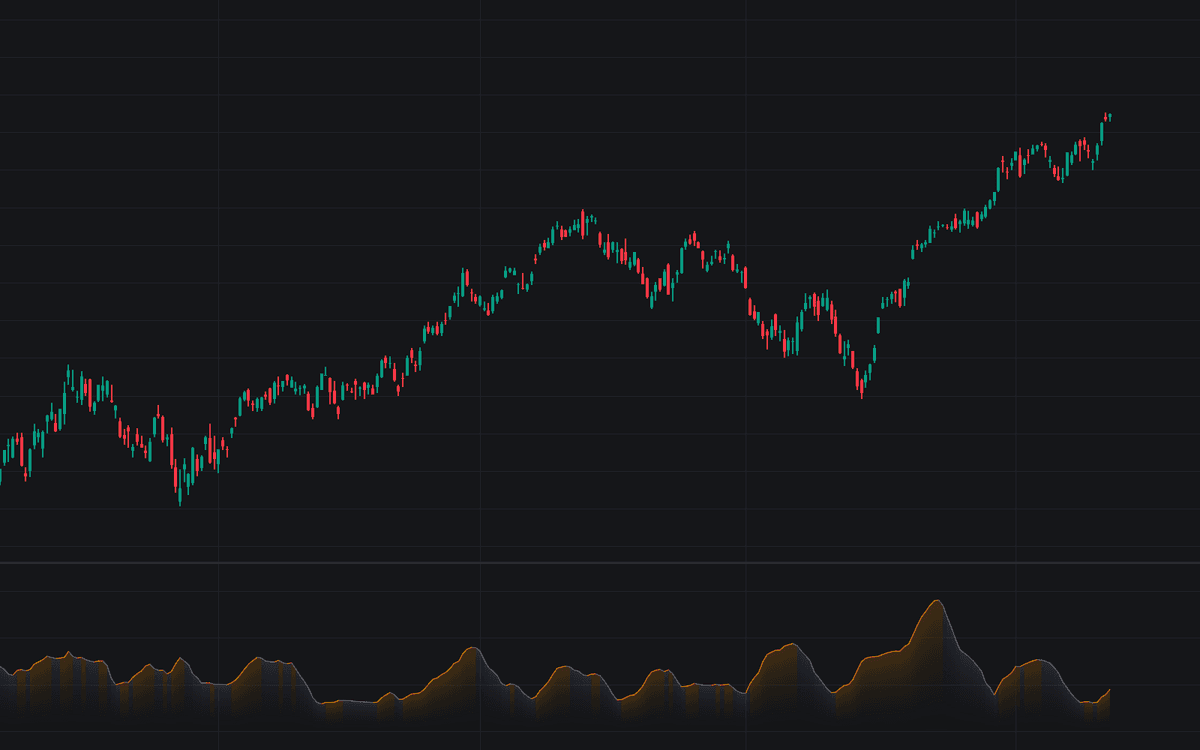

Standard Deviation computes the standard deviation of a selected price source over a lookback window and plots it as a single line, quantifying how far prices deviate from their mean so traders can watch volatility expand and contract directly. Defaults are a length of 20 on the closing price. This is the plain statistical measure in its raw form (no bands, no smoothing, no overlays), and that austerity is the appeal: the line rises when moves get larger, falls when the market tightens, nothing else.
How to Trade the Standard Deviation?
- Rising line: dispersion is expanding; bars are traveling farther from their recent mean, the signature of an active or trending tape.
- Falling line: contraction; price is coiling around its average and the market is going quiet.
- Extreme low readings: compression phases that squeeze-style traders monitor as the base conditions from which expansions are anticipated.
- Extreme high readings: dispersion at its widest, typical of climactic sessions, news shocks, or capitulation bars.
- No directional content: the line is unsigned: identical readings can accompany a surge or a collapse, so direction must come from another tool.
Because the value is denominated in price units, its absolute size scales with the instrument's price level; compare readings against the same symbol's own history rather than across markets.
Standard Deviation Settings
- Length (default 20): the number of bars used to compute the standard deviation. Shorter windows react quickly to a single large bar and fade just as fast; longer windows describe the prevailing volatility regime.
- Source (default close): the price series the standard deviation is calculated on.
Frequently Asked Questions

The Library is free. Quant makes it yours.
Pull any concept or indicator into Quant: rebuild it, retune it, or turn it into a backtested strategy of your own.