
Explore the Balance of Power indicator to understand market dynamics between buyers and sellers, enhancing your trading strategies.
The Balance of Power (BOP) indicator helps traders measure the control between buyers and sellers in financial markets. It works by analyzing where the closing price falls within a trading session’s range, producing values that indicate either bullish or bearish momentum. Positive values suggest buyers are in control, while negative values point to seller dominance. This indicator is especially useful for spotting trend reversals, identifying overbought or oversold conditions, and confirming momentum shifts when combined with other indicators.
Key Points:
- Formula: BOP = (Close - Open) / (High - Low)
- Values: Oscillates around zero; above zero = bullish, below zero = bearish.
- Signals: Zero-line crossovers, divergences (price vs. BOP), and extreme readings.
- Applications: Works best with high-volume stocks and ETFs during regular trading hours (NYSE schedule).
- Limitations: Can produce false signals in sideways markets or during low trading volumes.
For better accuracy, traders often smooth BOP data with moving averages (e.g., 14-day SMA) and combine it with LuxAlgo on TradingView for automated alerts, divergence detection, and enhanced decision-making.
Balance of Power (BOP) Indicator — Simply Explained
How the Balance of Power Indicator Works
Grasping how the Balance of Power (BOP) indicator operates can enhance your ability to analyze market momentum. Essentially, the BOP evaluates where the closing price sits within a trading session's range and translates this into a numerical value that fluctuates around zero.
BOP Calculation Formula
The formula for calculating the Balance of Power is straightforward:
BOP = (Close - Open) / (High - Low)
In this equation:
- (Close - Open) represents the net price movement during the session.
- (High - Low) defines the day's trading range.
Positive BOP values suggest buyers are in control, while negative values indicate sellers have the upper hand. This calculation acts as the foundation for interpreting the chart signals discussed in later sections.
The formula also adjusts for varying levels of volatility across different stocks and timeframes. For instance, a stock moving from $50.00 to $52.00 with a $4.00 range produces the same BOP value as a stock moving from $100.00 to $104.00 with an $8.00 range, as long as the proportional relationship between the price change and the range remains consistent.
Reading BOP Values and Charts
BOP values typically range between -1.0 and +1.0, although extremes are uncommon in real-time market conditions. During regular trading hours, the indicator's readings usually fall within a narrower band.
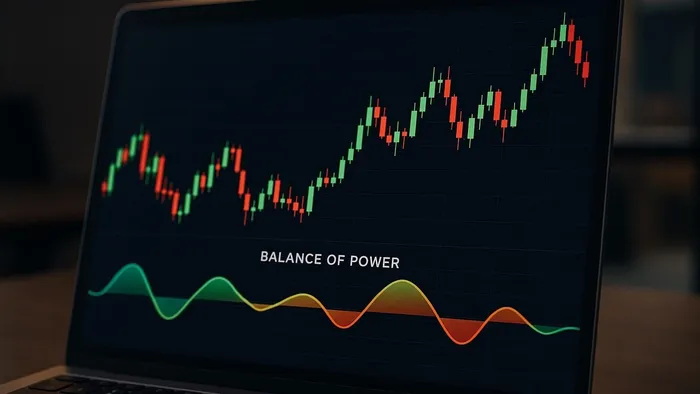
On platforms like TradingView, the BOP is displayed below the main price chart. Values above zero indicate bullish momentum, while those below zero point to bearish sentiment. These readings can help traders spot trends and potential reversals. For additional background on BOP’s design and interpretation, see StockCharts ChartSchool on BOP.
For example, a sharp move from negative to positive values may signal growing buying interest, whereas a sudden drop from positive to negative could indicate increasing selling pressure.
Smoothing BOP Data with Moving Averages
Raw BOP data can be noisy, so traders often smooth it out using a Simple Moving Average (SMA). The choice of SMA depends on the trading style:
- 5–10-day SMA: Common for day trading.
- 14-day SMA: Popular among swing traders holding positions for several days to weeks.
- 21-day or longer SMA: Typically used for position trading.
The 14-day SMA strikes a good balance between responsiveness and stability, making it a go-to option for swing traders aiming to filter out short-term market fluctuations while still capturing meaningful trends.
Reading Balance of Power Signals
Understanding Balance of Power (BOP) signals can help traders grasp the ongoing battle between buyers and sellers. By interpreting these signals, traders can identify shifts in market momentum before they become evident on price charts. The BOP indicator offers three main types of signals that provide valuable insights into potential market movements.

Zero-Line Crossovers
Zero-line crossovers are one of the simplest and most important BOP signals, indicating a change in market control. When the BOP crosses above zero, it signals that buyers are gaining the upper hand. On the flip side, a move below zero suggests that sellers are taking control.
To confirm these signals, combine them with a smoothed moving average. A bullish signal is observed when the BOP crosses above zero and stays positive over several sessions, particularly if the smoothed line follows the same trend. This indicates sustained buying pressure rather than a short-lived spike.
For a bearish signal, look for the BOP to drop below zero and remain negative across multiple sessions. This suggests that sellers have established dominance.
Pay attention to the nature of the crossover: sharp movements often signal strong momentum, while gradual shifts may point to weaker trends. For a platform-side definition, see TradingView’s BOP help page.
Spotting Divergences for Trend Reversals
Divergences add another layer of insight to BOP signals, helping traders anticipate trend reversals. These occur when the BOP moves in a direction contrary to the price, signaling a potential shift before it becomes obvious (what divergence means in technical analysis).
A positive (bullish) divergence happens when an asset's price hits new lows, but the BOP forms higher lows. This indicates that selling pressure is easing, even as prices decline.
A negative (bearish) divergence arises when prices reach higher highs, but the BOP shows lower highs. This suggests that the buying momentum is weakening despite rising prices.
The most striking divergence signals occur when the BOP completely contradicts price movements. For example, if prices are making new highs but the BOP turns negative, this mismatch often foreshadows a significant reversal.
Identifying Overbought and Oversold Levels
The BOP indicator is particularly useful for identifying points where buying or selling pressure becomes excessive. Since the BOP oscillates between -1 and +1, readings near these extremes often signal overbought or oversold conditions (for background, see what “overbought” means).
Overbought conditions occur when the BOP moves above zero and approaches +1, reflecting intense buying pressure. A decline from these extreme positive levels can act as a caution signal.
Oversold conditions develop when the BOP dips below zero and approaches -1, indicating strong selling pressure. A rise from these extreme negative values can signal a potential rebound.
To refine these signals, set overbought and oversold thresholds based on historical extremes. A sell signal is sometimes triggered when the BOP crosses below a user-defined overbought threshold after exceeding it; conversely, a buy signal can occur when the BOP crosses above a user-defined oversold threshold after falling below it.
The accuracy of these signals improves when combined with other factors, such as volume patterns or key support and resistance levels. However, remember that extreme BOP readings can persist in strongly trending markets. Patience and additional confirmation can help avoid premature trades.
Using BOP with LuxAlgo on TradingView

LuxAlgo provides indicators and features on TradingView that work well alongside BOP—helping you spot clearer signals and minimize false positives through automated confirmations. Here’s how to set up and maximize BOP using LuxAlgo’s capabilities.
Setting Up the BOP Indicator
To get started, add the standard BOP indicator to your TradingView chart and pair it with the Oscillator Matrix. This combination helps automatically identify divergence patterns and potential reversal points that might be missed during manual analysis.
You can adjust the BOP smoothing period to fit your trading approach—shorter periods often suit day trading, while longer ones suit swing trading. With LuxAlgo’s Alert Scripting and Signals & Overlays alerts, you can set precise alerts for key BOP events such as zero-line crossovers, extreme readings (e.g., above +0.8 or below −0.8), or divergence patterns. Saving your configurations as templates can streamline future use. If you prefer to evaluate ideas programmatically, explore AI Backtesting to prototype strategies quickly.
Combining BOP with LuxAlgo Toolkits
LuxAlgo’s toolkits complement BOP analysis with additional context. The Price Action Concepts (PAC) toolkit automates price action—order blocks, market structure shifts, trendlines, and patterns. When BOP shows bullish or bearish divergence, PAC can confirm whether price is nearing critical support or resistance levels, providing a second layer of confirmation.
The Signals & Overlays (S&O) toolkit adds trend-following and overlay features that can strengthen BOP signals—e.g., a zero-line crossover in BOP becomes more reliable when S&O outputs align. Additionally, the Oscillator Matrix scans for divergences across multiple oscillators (RSI, MACD, and more), further validating potential reversals. For broader context, indicators like Market Sentiment Technicals can help assess overall conditions.
For hands-off monitoring, set alerts that trigger when BOP alignment coincides with PAC order blocks or S&O trends, reducing noise and highlighting higher-probability opportunities.
Trading Example for U.S. Markets
Consider a hypothetical setup in Apple Inc. (AAPL). As price approaches a known resistance zone, the BOP reveals negative divergence—price prints higher highs while BOP forms lower highs, signaling weakening buying momentum.
LuxAlgo’s Oscillator Matrix flags this divergence, while the PAC toolkit marks a nearby resistance area. When S&O also cools from bullish conditions, and other momentum indicators soft-check the move, the alignment—bearish BOP crossover, PAC resistance, and divergence signals—builds a compelling short bias.
Beyond individual trades, LuxAlgo’s indicators can scale your workflow. For instance, you can screen indices using the OSC Screener, PAC Screener, or S&O Screener to find similar BOP contexts across markets during busy periods like earnings season.
BOP Pros, Cons, and Trading Tips
Benefits of the BOP Indicator
The Balance of Power (BOP) indicator offers insights beyond price alone. By analyzing the strength behind moves, it helps traders understand who’s in control—buyers or sellers—giving a clearer picture of market sentiment.
One of its standout features is its ability to detect early divergences, often signaling potential trend reversals before they appear on price alone.
The BOP indicator tends to be more reliable on highly liquid, high-volume U.S. securities—for example, constituents of the S&P 500—because deeper liquidity typically reduces noise.
Another advantage is its compatibility with other technical tools. BOP complements trend and momentum indicators (e.g., RSI or MACD) by adding insight into buying/selling pressure, which can help refine entries and exits.
BOP Indicator Drawbacks
Despite its strengths, BOP has important limitations. It can produce false signals in sideways markets and during low-volume periods. Smoothing can help—but it also introduces lag, which may delay actionable signals.
BOP can also react poorly to gap openings—for example, after earnings or major news—because large overnight gaps distort the (High − Low) denominator.
Finally, BOP is less suited to thinly traded symbols where ranges and closes are erratic.
Trading Tips for U.S. Markets
- Tailor your smoothing to your approach. For day trading liquid names (e.g., AAPL), consider 5–10 periods; for swing trading, 14–21 often filters noise.
- Combine BOP with LuxAlgo indicators for confirmation—Oscillator Matrix for divergences, PAC for structure and S&R, and S&O for trend confirmation.
- Focus on regular trading hours (9:30 a.m.–4:00 p.m. ET) when volume is highest (NYSE hours).
- Stick to major indices and liquid ETFs when learning; liquidity supports cleaner signals.
- Automate monitoring using S&O alerts or prototype rules in AI Backtesting before committing capital.
Conclusion
The Balance of Power (BOP) indicator measures the tug-of-war between buyers and sellers, offering early clues about shifts in market dynamics. Because BOP oscillates around zero—positive readings indicating buyer strength and negative readings indicating seller dominance—it can help with timing, especially when combined with liquidity-aware practices and confirmation from other indicators.
LuxAlgo enhances the utility of BOP by automating signal detection and integrating it with other features. Pairing BOP with Oscillator Matrix for divergence detection or Price Action Concepts for structure and Signals & Overlays for trend context can reduce false positives and improve decision-making.
No single indicator is perfect. In choppy environments, BOP may whipsaw; that’s why filters, confluence, and disciplined risk management matter.
FAQs
How can I use the Balance of Power (BOP) indicator with other tools to improve my trading decisions?
The Balance of Power (BOP) indicator works best when used alongside other technical analysis tools. Pairing it with methods like trendlines, Fibonacci retracements, or support and resistance levels can provide extra confirmation of market trends and highlight potential reversal points. For momentum context, see RSI (what RSI measures).
By combining the BOP indicator with these tools, traders can cross-check signals and better understand market momentum. This helps in making more informed decisions—whether you’re planning to enter, exit, or refine a position.
What challenges does the Balance of Power (BOP) indicator face in low-volume or sideways markets, and how can traders address them?
BOP tends to falter in low-volume or sideways markets, often leading to false signals or sluggish reactions. In such scenarios, it becomes challenging to gauge momentum accurately.
To navigate these limitations, combine BOP with volume analysis and trend confirmation. LuxAlgo’s Signals & Overlays and PAC can serve as filters; alerts can be configured via S&O alerts to surface only high-confluence conditions.
How does the Balance of Power (BOP) indicator reveal market psychology beyond traditional price analysis?
The Balance of Power (BOP) indicator offers a view into the conviction behind price moves by comparing where the close occurs within the range. Unlike price-only tools, BOP highlights pressure asymmetries (buyer vs. seller control) that can precede turns. It’s especially informative when paired with structure from PAC and divergence checks in Oscillator Matrix. For a general reference, see StockCharts on BOP.
References
LuxAlgo Resources
- LuxAlgo — Official Site
- AI Backtesting Assistant
- Oscillator Matrix — Reversal Signals (Docs)
- Alert Scripting — How to Use (Docs)
- Signals & Overlays — Alerts (Docs)
- Understanding Moving Averages (Blog)
- How to Spot Reversals (Blog)
- Oscillator Matrix (Library)
- Price Action Concepts (Library)
- Signals & Overlays (Library)
- Support & Resistance Levels with Breaks (Library)
- Moving Averages Proximity Oscillator (Library)
- Triangular Momentum Oscillator — Real-Time Divergences (Library)
- Market Structure Oscillator (Library)
- Market Sentiment Technicals (Library)


