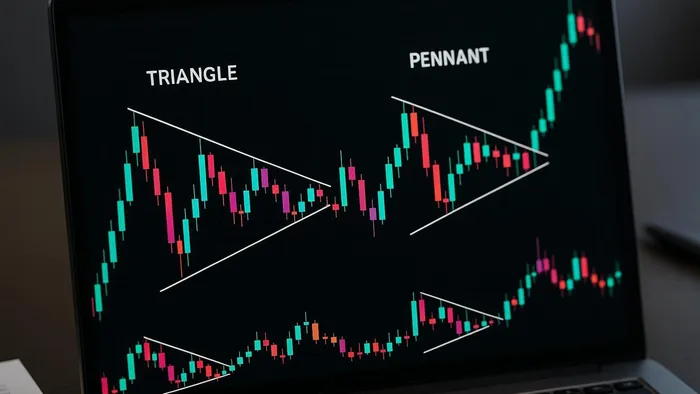

Learn to trade smarter with essential chart patterns like triangles and pennants, vital for predicting market movements and breakouts.
Want to trade smarter with chart patterns? Start with two essential ones: Triangles and Pennants. These patterns help predict price movements by showing market consolidation and potential breakouts. Here’s what you need to know:
-
Triangles: Formed over weeks or months, they signal trend continuation or reversal. Types include:
- Ascending: Bullish breakout likely.
- Descending: Bearish breakdown likely.
- Symmetrical: Neutral until breakout direction is clear.
-
Pennants: Short-term patterns (1-4 weeks) following sharp price moves, signaling trend continuation. Key points:
- Bullish Pennants: Breakout above the upper trendline in uptrends.
- Bearish Pennants: Breakout below the lower trendline in downtrends.
Quick Comparison:
| Aspect | Triangles | Pennants |
|---|---|---|
| Formation Time | Weeks to months | 1-4 weeks |
| Shape | Converging trendlines | Compact, flag-like |
| Volume Behavior | Declines, then spikes | High during flagpole, low during consolidation |
| Breakout Timing | 50-75 % of pattern | Near the apex |
| Trend Context | Continuation or reversal | Continuation only |
Why it matters: These patterns offer clear entry and exit points, risk management via stop-losses, and defined profit targets. Start by identifying these patterns on charts, confirm with volume trends, and use resources like LuxAlgo for automation.
Pro Tip: Watch for false breakouts (low volume, weak momentum) and always manage risk with stop-losses and position sizing. Ready to level up your trading? Dive into the full guide for detailed strategies!
The Ultimate Chart Patterns Trading Course (Expert in 1 Hour)
Triangle Patterns
Triangle patterns represent a phase of market consolidation, where price movements narrow as tension builds, often leading to a decisive breakout. Here's a closer look at the different types of triangle patterns and their trading implications.
Ascending Triangle Analysis
An ascending triangle forms when buyers consistently push prices higher against a flat resistance level, creating a rising support line. This pattern reflects increasing demand and suggests that buyers are gradually gaining control.
Key traits of an ascending triangle:
- A flat resistance line at the top
- A rising support line at the bottom
- Decreasing volume as the pattern develops
- Often signals a bullish continuation
"Triangles are known as continuation patterns, meaning the trend stalls out to gather steam before the next breakout or breakdown." – InvestorsUnderground.com
Descending Triangle Analysis
A descending triangle, on the other hand, shows growing selling pressure against a flat support level, with a falling resistance line signaling a readiness to accept lower prices.
Key elements of a descending triangle:
- Volume increases during breakout moments
- Price action typically occurs between 50-75 % of the pattern's completion
- Breaks in support or resistance lines are critical
- Retests of broken levels often confirm the breakout or breakdown
Symmetrical Triangle Analysis
Symmetrical triangles are characterized by two converging trendlines with similar slopes, reflecting a temporary balance in the market. As noted by Edwards and Magee, pioneers in technical analysis, around 75 % of symmetrical triangles act as continuation patterns.
To correctly identify a symmetrical triangle:
- Look for at least four touchpoints (two highs and two lows)
- Volume should decline as the pattern develops
- Price targets can be estimated based on the triangle's height
| Triangle Type | Key Features | Typical Outcome |
|---|---|---|
| Ascending | Flat top, rising bottom | Bullish breakout |
| Descending | Flat bottom, falling top | Bearish breakdown |
| Symmetrical | Equal-sloped converging lines | Often follows prior trend (75 %) |
When trading triangle patterns, wait for a confirmed breakout—ideally between the halfway and three-quarter mark of the pattern's development. Entering too early can lead to false signals. Place stop-losses just beyond the opposite trendline and adjust your position size based on your risk tolerance.
Pennant Patterns
Pennants form after a strong price movement (called the flagpole) and a brief consolidation phase that creates a small symmetrical triangle. This setup typically signals a continuation of the prevailing trend.
Trading Bullish Pennants
Bullish pennants emerge during uptrends, signaling a temporary pause before the upward momentum resumes. Focus on these points:
- Entry Timing: Look for a breakout above the upper trendline, ideally with rising volume.
- Stop Loss Placement: Position your stop just below the pennant’s lower trendline.
- Profit Target: Aim for a price move equal to the height of the flagpole, measured from the breakout point.
| Component | Characteristics | Trading Implications |
|---|---|---|
| Entry Timing | Break above the upper trendline | Confirm breakout with rising volume |
| Stop Loss | Below the lower trendline | Protect against false breakouts |
| Profit Target | Equal to the flagpole height | Project move from the breakout point |
Trading Bearish Pennants
Bearish pennants surface in downtrends, signaling a brief pause before the downward trend continues.
- Volume Profile: Look for heavy selling volume during the flagpole, followed by declining volume during consolidation.
- Pattern Duration: Ensure the pattern completes within the typical 1-3 week window.
- Breakout Confirmation: Wait for a clear break below the lower trendline.
| Entry Strategy | Stop Loss Placement | Target Calculation |
|---|---|---|
| Conservative | Just above the upper trendline | Target a move equal to the flagpole height |
| Aggressive | Near the pennant’s apex | Use Fibonacci extensions for multiple targets |
| Breakout Retest | Above the retest level | Aim for a move equal to the flagpole height |
Key Differences Between Pennants and Flags
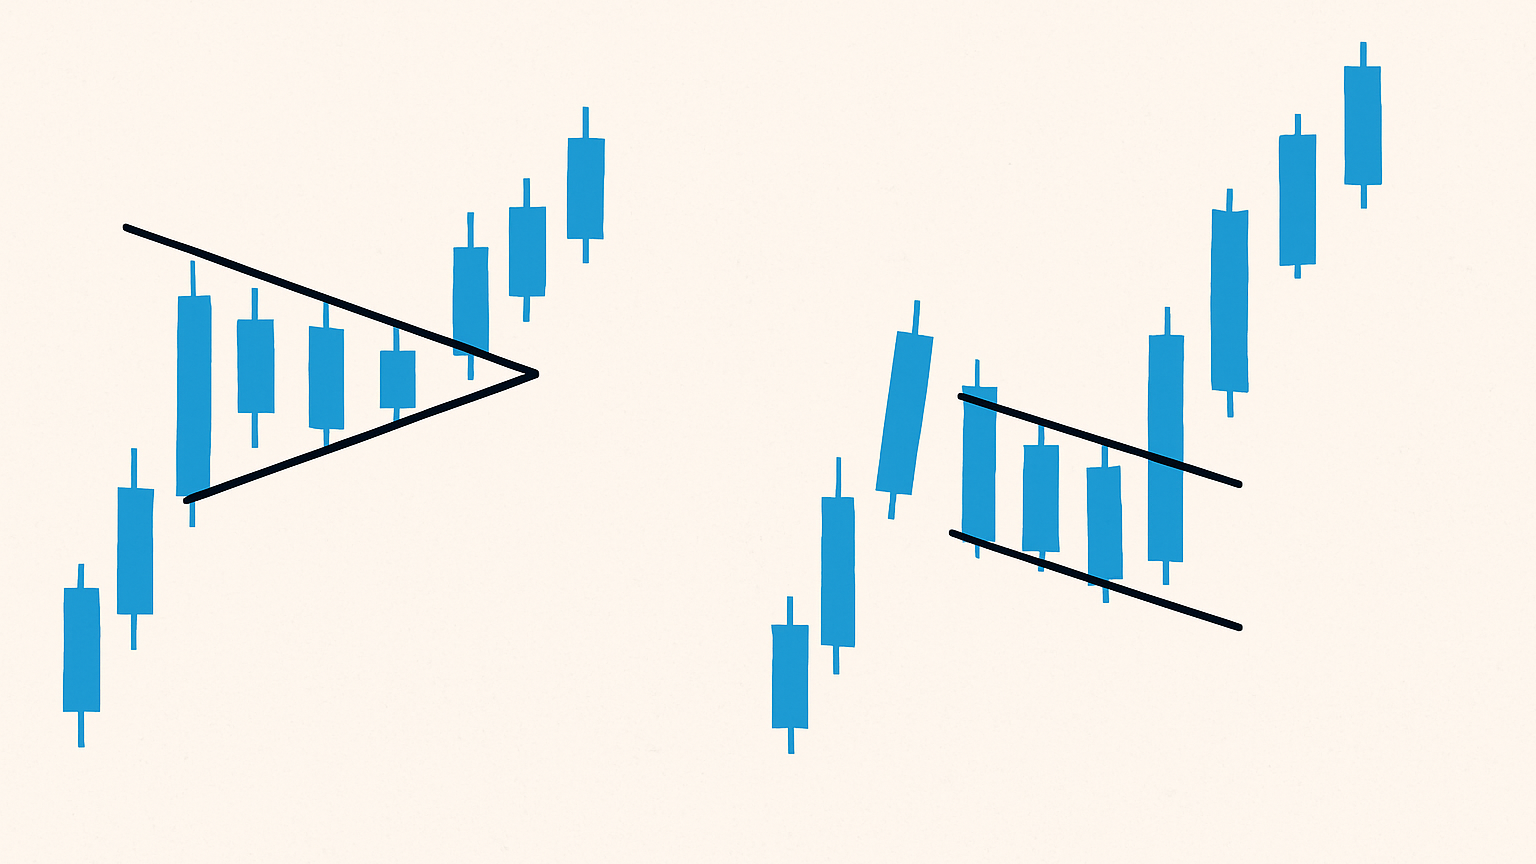
While pennants and flags are both continuation patterns, their structures set them apart. Pennants feature converging trendlines during the consolidation phase, forming a triangle-like shape. In contrast, flags maintain parallel trendlines. Recognizing these subtle differences can enhance your ability to identify and trade these patterns effectively, setting the stage for a more nuanced understanding of market behavior.
Triangles vs Pennants
Pattern Comparison Guide
The main differences between triangles and pennants lie in their formation and what they indicate. Triangles may take months to form, while pennants are quicker (1-4 weeks). Pennants are always preceded by a sharp price movement, known as the flagpole, whereas triangles are not.
| Volume Behavior | Symmetrical Triangle | Pennant Pattern |
|---|---|---|
| Initial Phase | Steady decline | High volume during flagpole |
| Middle Phase | Gradual decrease | Low volume during consolidation |
| Breakout Phase | Volume increase at breakout | Sharp volume spike at breakout |
| Pattern Duration | Months to years | 1-4 weeks |
Trading Implications
These patterns directly impact trading strategies. Symmetrical triangles are neutral until a breakout occurs, while pennants typically continue the prior trend.
Size and Shape Differences
Triangles are larger and have clearly converging trendlines. Pennants are smaller and resemble compact, flag-like shapes. If a pennant-like pattern lasts more than 12-13 weeks, it’s probably a triangle instead.
| Aspect | Symmetrical Triangle | Pennant Pattern |
|---|---|---|
| Size | Large | Compact |
| Shape | Pronounced convergence | Flag-like appearance |
| Location | Can form anywhere in a trend | Always follows sharp price moves |
| Breakout Timing | 50-75 % of pattern completion | Near the apex |
Pattern Recognition Tips
- Time Duration: If the pattern lasts more than three months, it’s likely a triangle.
- Prior Movement: Check for a flagpole to confirm a pennant.
- Pattern Size: Compare the pattern’s size to recent price moves.
- Volume Profile: Match volume changes to typical behavior for each pattern.
Trading Methods
Timeframe Analysis
Multi-timeframe analysis helps you spot opportunities, confirm trends, and pinpoint precise entries and exits.
- Primary Timeframe: Identify patterns on your main chart, paying close attention to support and resistance levels.
- Higher Timeframe: Confirm alignment with the broader trend.
- Lower Timeframe: Refine your entry once the pattern is confirmed.
LuxAlgo Pattern Tools
LuxAlgo provides trading resources that streamline your decisions. The Price Action Concepts (PAC) toolkit and Signals & Overlays (S&O) toolkit are especially useful for identifying patterns and confirming breakouts in real time.
| Feature | PAC Toolkit | S&O Toolkit |
|---|---|---|
| Pattern Detection | Automated pattern identification | Immediate breakout notifications |
| Volume Analysis | Volume profile overlays | Indicators for volume confirmation |
| Alert System | Alerts for pattern completion | Alerts for breakout confirmations |
| Risk Management | Support and resistance levels | Dynamic stop-loss recommendations |
Trading Examples
-
S&P 500 Ascending Triangle Trade
In March 2025, the S&P 500 displayed an ascending triangle identified by the PAC toolkit.- Entry: Breakout above 4 850 resistance
- Stop-loss: 4 780, just below the lower trendline
- Target: 4 990, based on the pattern height
- Volume Confirmation: 150 % above the 20-day average
- Pattern Duration: 3 weeks
-
Bitcoin Bullish Pennant Trade
In April 2025, Bitcoin formed a bullish pennant following a surge from 52 000 USD to 58 000 USD.- Flagpole Height: 6 000 USD
- Pennant Consolidation: Retraced to the 38.2 % Fibonacci level
- Entry Trigger: Breakout above 57 500 USD
- Stop-loss: 56 800 USD
- Target: 64 000 USD
Shorter consolidation phases often lead to stronger breakouts. In both cases, LuxAlgo confirmed moves with volume analysis and multi-timeframe alerts, simplifying the decision-making process.
Pattern Failures
Even solid patterns can fail. Spotting these failures early and managing risk effectively is key.
False Breakout Signs
Volume and price action help reveal false breakouts. Watch for these red flags:
| Warning Sign | Key Characteristics | Action to Take |
|---|---|---|
| Low Volume Breakout | Volume below the 20-day average | Wait for volume confirmation |
| Price Rejection | Price quickly reverses | Exit if price closes back in pattern |
| Weak Momentum | Price moves sluggishly | Reduce position size |
| Pattern Duration | Pattern runs too long | Reevaluate pattern validity |
Risk Management
Managing risk starts with smart stop-loss placement and proper position sizing.
- For bullish patterns, place stops below support. For bearish patterns, place stops above resistance.
- Limit risk to 1-2 % of total capital per trade.
LuxAlgo’s pattern tools can send real-time alerts when patterns start to fail, monitoring volume divergence, momentum shifts, and support or resistance violations.
Conclusion
Excelling with triangle and pennant patterns requires technical knowledge, disciplined practice, and reliable resources. LuxAlgo’s Price Action Concepts and Signals & Overlays modules simplify pattern recognition by automating detection and providing actionable insights. Pair these with disciplined risk management to strengthen your strategy.
"LuxAlgo has really stepped my trading up, there is a setup for any style of trading you prefer, which is very nice." – Kevin Ortega
Consider adding LuxAlgo’s AI Backtesting Assistant to refine your approach through multi-timeframe validation and data-driven analysis.
FAQs
What’s the difference between a triangle pattern and a pennant pattern in chart analysis?
Triangle Patterns vs. Pennant Patterns
Triangle patterns emerge when trendlines converge over time, tightening price movement. Pennants are short-term formations preceded by a sharp price move called the flagpole.
What are some common mistakes traders make with triangle and pennant patterns, and how can they avoid them?
Common pitfalls include jumping in without a confirmed breakout, ignoring the broader trend, and setting unrealistic targets or overly tight stops. Waiting for volume-backed breakouts and keeping stops just outside pattern boundaries can mitigate these issues.
How does trading volume impact the reliability of triangle and pennant patterns?
Volume typically declines during pattern formation and spikes on breakout. A strong volume surge confirms the breakout’s validity, reducing the odds of false signals.
References
- Trend Lines Indicator
- Breakouts with Tests and Retests Indicator
- LuxAlgo Home
- Volume Profile Maps Indicator
- Fibonacci Extensions Guide
- AI Backtesting Strategy Fetching
- Support and Resistance Dynamic Indicator
- Volumetric Toolkit Indicator
- Signals & Overlays Volume Overlay
- Backtester Alerts Documentation
- TP / SL Placement Guide
- Price Action Concepts Alerts
- Candle Body Support and Resistance Indicator
- Price Action Concepts on TradingView
- AI Backtesting Assistant Main Page


