Zig Zag Indicator: Filtering Noise to Highlight Significant Price Swings
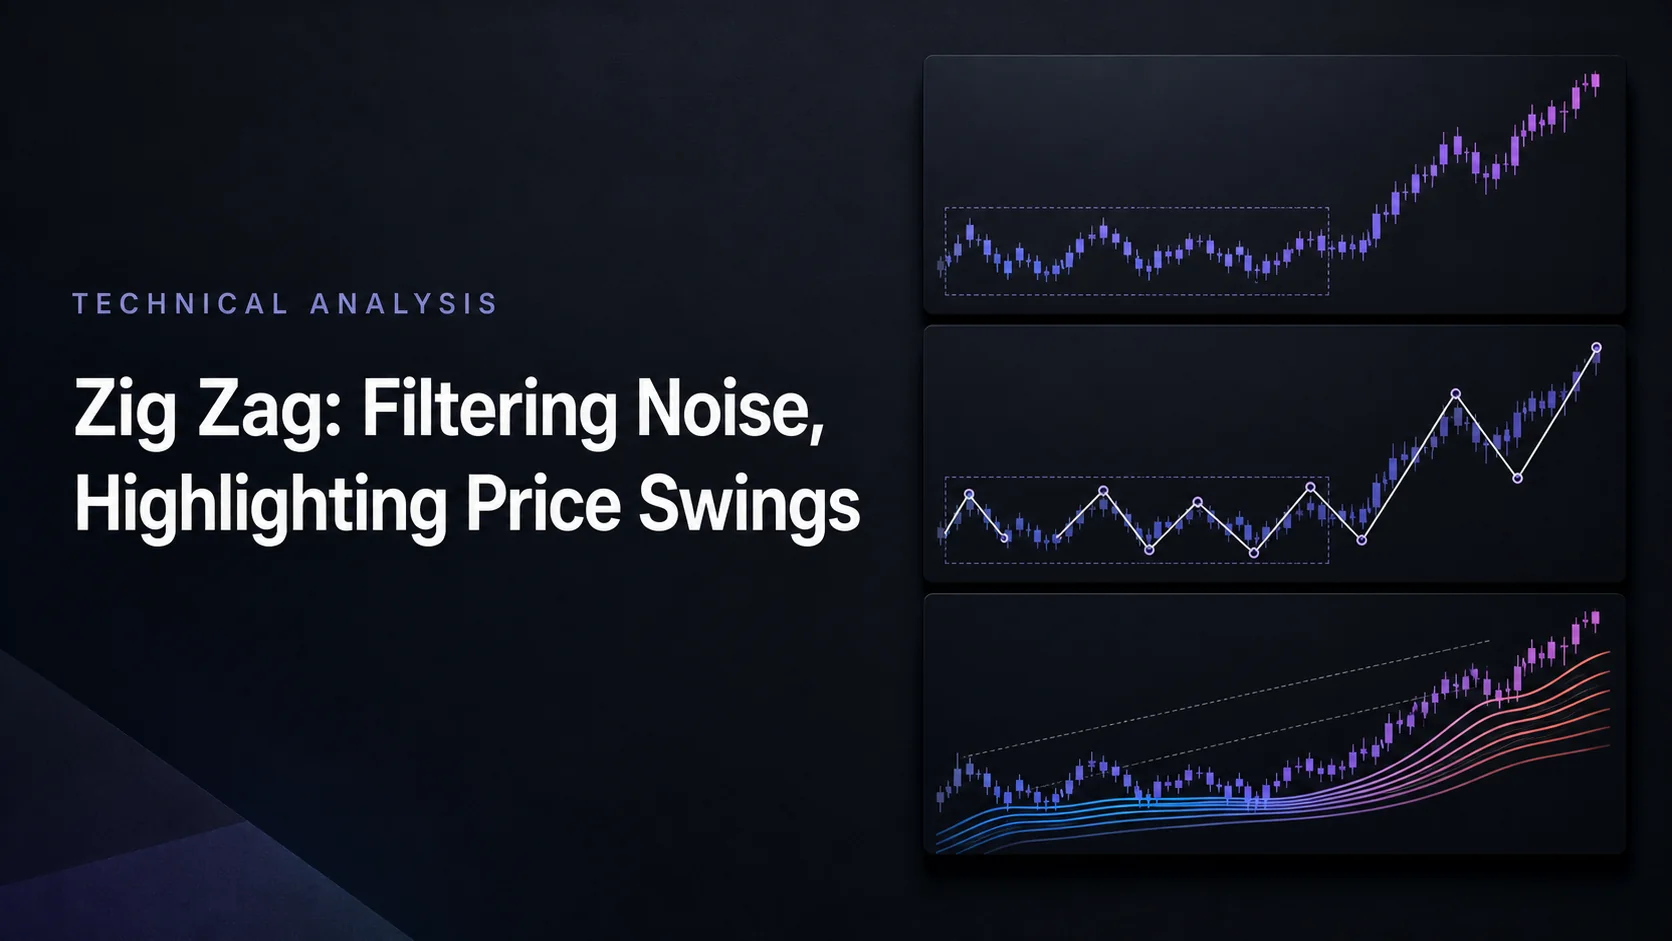
The Zig Zag indicator redraws a price chart as a sequence of straight legs between swing highs and swing lows, keeping only the reversals that exceed a size threshold and discarding everything smaller as noise. With a 5% threshold, a rally stays a single up leg until price has fallen 5% from its highest point; only then is that high confirmed as a pivot and a down leg begun. The result is a chart reduced to the moves that matter at the scale you chose, which is why traders use it to read trend sequence, find double tops and other patterns, and anchor Fibonacci measurements. It describes the past precisely and the present provisionally: the newest leg keeps moving until the next reversal confirms it.
Key Insights
- Purpose: data reduction. The indicator decides which swings count at a given scale so that structure, patterns and measurements can be read from a few pivots instead of hundreds of candles.
- How it works: it tracks the running extreme of the current leg and confirms a pivot only when price reverses from that extreme by more than the threshold, then alternates strictly between highs and lows.
- Settings: a reversal size (a percentage of price, a fixed amount or an ATR multiple, depending on the build) plus a minimum bar spacing. Larger values keep only major swings and confirm them later.
- Uses: trend sequence from higher highs and lows, pattern outlines, swing-based stops and breakout levels, and anchors for Fibonacci retracements.
- Limitation: the last leg repaints by design, and every pivot is known only after the reversal that confirms it. The tool is an input to a rule, not a signal on its own.
The Zig Zag is best paired with tools that supply what it lacks: a direction filter such as a moving average, a momentum read such as RSI or MACD, and a risk rule sized from the swing it draws. The LuxAlgo ZigZag in the Library opens on Quant Charts in one click, and Quant, our coding agent, can help turn a swing rule into a strategy you can inspect in Code and test with Run.
How the Zig Zag Indicator Works
The indicator is fully mechanical, so the clearest way to understand it is to walk the algorithm. Everything it draws follows from one rule applied bar by bar.
How It Calculates Movements
Start from the last confirmed pivot low. While the up leg runs, the indicator records the highest high reached since that low. Each new bar is checked against that extreme: if the bar makes a higher high, the extreme moves up and the provisional leg stretches with it; if the bar's low is more than the threshold below the extreme, the extreme is confirmed as a pivot high, the leg is fixed, and a down leg begins from it. The same logic runs in mirror image on the way down. Pivots therefore alternate strictly: one high, one low, never two of the same kind in a row.
A hypothetical example with a 5% threshold. Suppose Tesla (TSLA) rallies from a confirmed low at $200.00 to $220.00. A pullback to $210.00 is a 4.5% retreat, short of the threshold, so the $220.00 high remains provisional and the up leg is still live; if price then prints $225.00 the extreme simply moves to $225.00. If instead price falls to $209.00, the retreat from $220.00 is exactly 5.0%, the $220.00 high is confirmed as a pivot, a leg is fixed from $200.00 to $220.00, and a down leg starts tracking the lowest low. Nothing was drawn at $220.00 when it printed; the pivot became knowable only at $209.00, ten dollars lower.
| Bar | Hypothetical price path | Running extreme | What the indicator does |
|---|---|---|---|
| 1 | Low $200.00 confirmed earlier | $200.00 (low) | Up leg begins |
| 2 to 6 | Rally to $220.00 | $220.00 | Provisional leg extends to each new high |
| 7 | Pullback low $210.00 | $220.00 | 4.5% retreat: below threshold, no pivot |
| 8 | Low $209.00 | $220.00 | 5.0% retreat: $220.00 confirmed as pivot high; down leg begins |
| 9 onward | Lower lows | Tracks lowest low | Down leg provisional until a 5% bounce confirms its low |
Customizing the Settings
Every build exposes two ideas: how big a reversal must be, and how tightly pivots may be spaced. The names and units differ by platform.
| Build | Reversal size | Spacing or confirmation | Notes |
|---|---|---|---|
| LuxAlgo ZigZag (Quant Charts) | Deviation (%), default 5, as a percentage of the leg extreme | Depth, default 10, minimum bars between two consecutive pivots | New Swing High and New Swing Low alerts fire on the confirmation bar |
| TradingView built-in Zigzag | Price deviation for reversals (%) | Pivot legs: total bars split left and right to confirm a pivot | Optional projected pivots drawn as a dashed line; labels for reversal price, change and cumulative volume |
| MetaTrader ZigZag | Deviation in points | Depth and Backstep | Fixed-point thresholds do not scale with price |
| ATR-based variants | k × ATR, commonly 2 to 3 | Varies | Threshold breathes with volatility |
Percentage thresholds compare across instruments and price levels; fixed-point thresholds suit a single contract; ATR multiples keep the swing count roughly stable when volatility changes. Some builds also let you choose whether pivots are measured from highs and lows or from closes. Closes produce cleaner pivots and fewer intrabar spikes; highs and lows capture the true extremes that stops tend to sit beyond.
Choosing a Threshold for the Market You Trade
There is no correct threshold, only the scale of structure you intend to analyze. A percentage means a very different dollar distance at different prices, and the same setting on a calm large-cap and a volatile crypto pair will mark swings of completely different character. The table shows what a 5% reversal requirement means in price units for a few hypothetical levels.
| Instrument and price | 5% reversal required | 1% reversal required | Practical reading |
|---|---|---|---|
| Stock at $20.00 | $1.00 | $0.20 | 5% is a normal swing on a daily chart |
| Stock at $500.00 | $25.00 | $5.00 | Same percentage, twenty-five times the dollar move |
| Bitcoin at $60,000 | $3,000 | $600 | 5% is common within a week; 1% is intraday noise |
| EUR/USD at 1.0800 | 0.0540 (540 pips) | 0.0108 (108 pips) | Percent thresholds run large in forex; many traders work in fractions of a percent or pips |
Rather than adopting a published range for stocks, crypto or forex, load the indicator on the chart you actually trade and raise the threshold until the legs match the swings you would trade by hand; then leave it alone so that structure reads stay consistent. A rule tested at one threshold has not been tested at another. Timeframe interacts with the setting: 5% on a daily chart outlines weekly and monthly swings, while 5% on an hourly chart may not confirm a pivot for days.
Using the Zig Zag Indicator in Technical Analysis
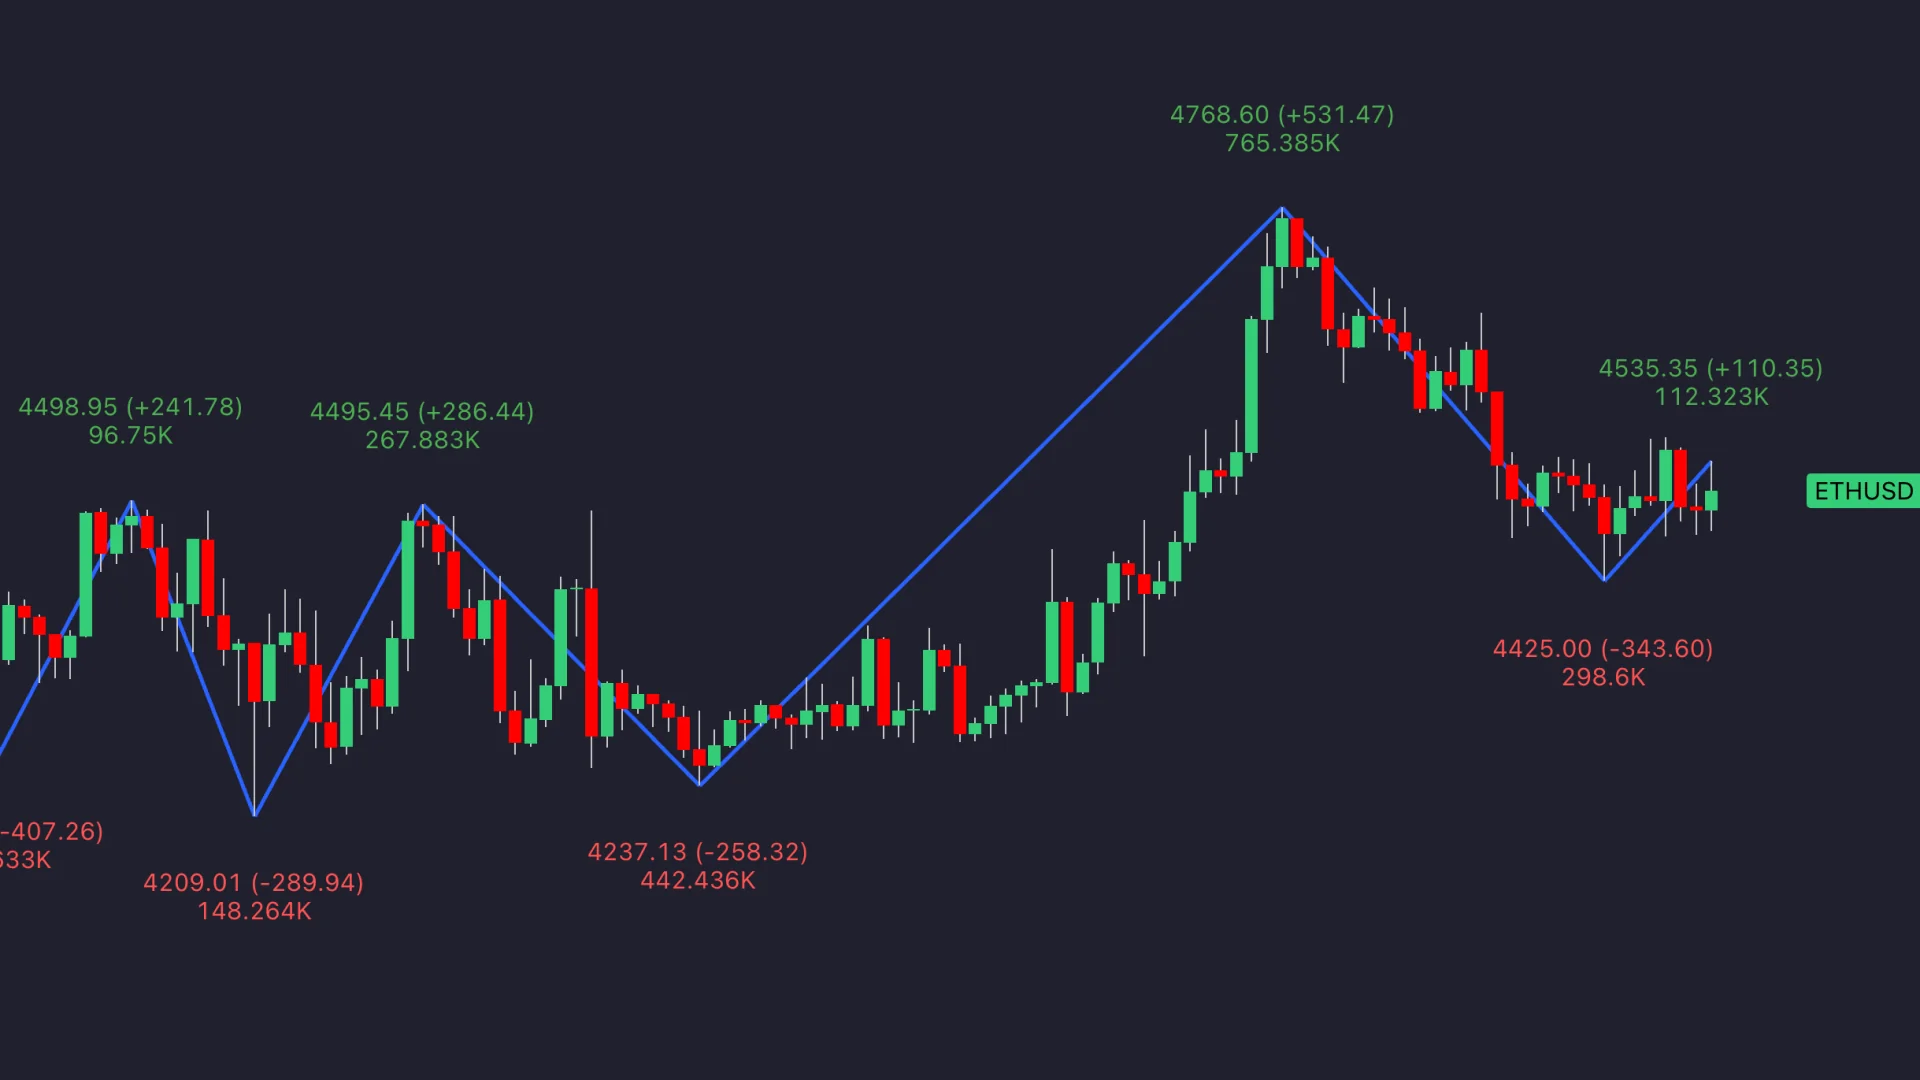
Once candles collapse into legs, structure that hides in bar noise becomes explicit: the sequence of highs and lows, the size and duration of each swing, and the shape that several swings make together.
Finding Trends and Reversals
Read the pivots in order. Successive higher swing highs and higher swing lows define an uptrend at the chosen scale; lower highs and lower lows define a downtrend. The first confirmed pivot that breaks the sequence, a lower high after a run of higher highs for example, is an early structural warning rather than a reversal in itself. The Library's zigzag structure page sets this out in detail, and Reversal Spotting Made Easy covers how swing sequence reading fits with other reversal evidence.
Two settings can legitimately disagree. A 2% threshold registers minor swings inside what a 10% threshold treats as a single leg, so one may print lower highs while the other still shows an unbroken uptrend. Neither is wrong; they describe different scales, which is why analysts often read a small and a large setting side by side.
Recognizing Chart Patterns
Pattern recognition is far more tractable on a polyline of a few pivots than on raw candles, which is how many algorithmic pattern scanners are built. A head and shoulders becomes three connected peaks with the middle one highest; double tops and bottoms become two pivots at similar levels; harmonic patterns such as the Gartley, Bat, Butterfly and Crab are measured between five zigzag pivots labeled X, A, B, C and D using Fibonacci ratios. Confirmed pivots are also the natural anchors for retracement and extension tools, and the levels of untouched pivots often act as support and resistance because stops cluster beyond them.
| Pattern type | What the Zig Zag supplies | What still has to be decided |
|---|---|---|
| Head and shoulders | Three peaks and the two troughs that define the neckline | Entry on the neckline break, target from head-to-neckline height, invalidation above the right shoulder |
| Double tops and bottoms | Two pivots near the same level with the intervening swing | Whether the second test must be lower, and where the break of the middle pivot is traded |
| Harmonic patterns | The X, A, B, C pivots and their retracement ratios | Projected D zone, confirmation at D, stop beyond the zone |
| Elliott wave counts | Discrete legs to count and compare | The count itself, which is subjective and can change as bars print |
A note on names: in Elliott vocabulary a "zigzag" is a specific 5-3-5 corrective pattern. The indicator shares the word and nothing else; it is the generic swing outline on which wave analysts draw their counts.
Understanding Its Lagging Nature
The Zig Zag lags by construction. A pivot is confirmed only after price has already reversed by the full threshold, so at a 5% setting the indicator identifies a top when the market is 5% below it. Bar-count builds add their own delay: TradingView's Pivot legs input of 10 requires five bars on each side of a high, so the pivot is drawn five bars after it occurred. This is not a flaw; it is the price of an objective definition of a swing.
The newest leg is different in kind from the confirmed ones. Its endpoint slides to every new extreme and can be removed entirely if price runs past the last pivot without first reversing by the threshold. Confirmed pivots never move afterward. Any rule, alert or backtest built on the indicator should consume confirmed pivots only, and should place its actions at the confirmation bar rather than at the extreme where the pivot is later drawn; the Library's repaint-safe engineering page explains why the distinction matters.
Adding the Zig Zag Indicator to Your Trading Strategy
The indicator gives a rule its swing points. The rule still has to specify direction, trigger, stop, target and size, and every one of those choices needs to be tested with the swings placed where they were actually confirmed.
Matching the Threshold to Your Holding Period
Choose the threshold from the horizon of the trade rather than from the asset's name. A day trader working an hourly chart wants a small percentage or a low ATR multiple so intraday swings are resolved; a position trader on a weekly chart wants a large one so a month of chop reads as a single leg. Volatility-scaled thresholds, typically 2 to 3 ATR, keep the swing count roughly stable as conditions change, which a fixed percentage cannot do. Whatever you choose, record it: a result cannot be reproduced without the threshold, the spacing input, the price source and the interval.
Using It with Other Indicators
The Zig Zag has no directional opinion and no timing; it draws structure. Other tools supply what it lacks, and the combined rule should be tested as one rule.
- Moving averages: a simple direction filter. Take breaks of swing highs only while a chosen average is rising, and the mirror image for shorts.
- RSI and MACD: momentum at a pivot is a separate piece of evidence. A confirmed swing high while RSI has already turned down is a hypothesis about exhaustion to test, not a confirmed signal.
- Market structure tools: break of structure and change-of-character labels are computed by comparing swing pivots, so a structure tool's threshold quietly decides what "structure" means. The Library's market-structure tools derive their labels from their own swing logic and do not read the Zig Zag indicator; agreement between them is something to test rather than a combined signal.
- Fractals: a Williams fractal confirms a pivot from a fixed five-bar shape regardless of the move's size, so fractals can cluster and print consecutive same-side pivots. A Zig Zag filters by size and forces alternation. The two are alternative swing definitions, not confirmations of each other.
Improving Entry and Exit Points
Swing pivots give entries, stops and targets objective homes. A common rule buys a break above the latest confirmed swing high, places the stop below the latest confirmed swing low, and projects the previous leg's length from the breakout as a target. Consider a hypothetical stock whose last confirmed up leg ran from $45.00 to $52.00, traded with a $25,000 account and a 1% risk budget of $250. See Risking It Right for the budgeting logic.
| Step | Calculation | Result before costs |
|---|---|---|
| Entry on break of the $52.00 swing high | Buy stop at $52.05 | Entry $52.05 |
| Stop below the latest confirmed swing low at $49.50 | $52.05 − $49.50 | $2.55 risk per share |
| Position size | $250 ÷ $2.55, rounded down | 98 shares; $249.90 planned risk; $5,100.90 notional |
| Target from the previous leg | $52.00 − $45.00 = $7.00 projected from $52.05 | $59.05; $7.00 reward against $2.55 risk, about 2.7R |
| Trailing stop | Move the stop below each new confirmed swing low | Locks in gains as the trend prints higher lows; each move waits for confirmation |
| Gap through the stop, fill at $49.10 | 98 × ($52.05 − $49.10) | $289.10 loss, about 1.16R; a stop level is not a guaranteed fill |
Two cautions follow from the lag. The trailing stop can only step up after the new swing low is confirmed, which happens after price has already bounced by the threshold, so it trails further behind than a hand-drawn stop would. And a projected target is a hypothesis about symmetry between legs; measure how often the market actually reaches it in your test before relying on it.
Pros and Cons of the Zig Zag Indicator
Main Benefits
The indicator's strength is noise control. Tyler Corvin of The Trading Analyst describes it as "highlighting major thoroughfares (trends) by ignoring trivial alleyways (minor fluctuations)," and that is exactly what a size filter does: every move below the threshold disappears, and the chart that remains is the one a trader would draw by hand, produced consistently and without judgment. That consistency is the second benefit. Once the parameters are set, two analysts see the same swings, patterns are easier to see, and swing levels can be measured, alerted on and coded. The idea is old and well founded: Dow Theory sorted movements into primary, secondary and minor tiers, Arthur Merrill's Filtered Waves (1977) studied only moves exceeding a fixed percentage, and point-and-figure charts encode the same principle in their box and reversal sizes.
Drawbacks to Know
The lag is unavoidable: a pivot is known only after the reversal that confirms it, so entries taken at confirmation give up the first threshold's worth of the new move. The last leg repaints, which makes the indicator look far better in hindsight than it behaves in real time, and a backtest that uses pivots where they are drawn rather than where they were confirmed contains lookahead bias and will overstate results. The indicator has no predictive content of its own, and in a range whose swings are close to the threshold it can flip frequently. All of these are properties of a swing detector rather than defects; they mean the Zig Zag must be paired with a rule that supplies direction and timing.
Quick Comparison: Pros vs Cons
| Advantages | Limitations |
|---|---|
| Removes moves below the threshold consistently and objectively | Confirms pivots only after a full-threshold reversal |
| Makes trend sequence, patterns and swing levels explicit | Newest leg repaints; hindsight charts flatter the tool |
| Works on any market and interval with the same rule | No universally correct threshold; scale must be chosen and kept |
| Supplies objective anchors for stops, breakouts and Fibonacci tools | No direction or timing of its own |
| Confirmed pivots are stable inputs for alerts and code | Backtests must shift pivots to their confirmation bars to avoid lookahead |
Using the Zig Zag Indicator on Quant Charts
Key Takeaways
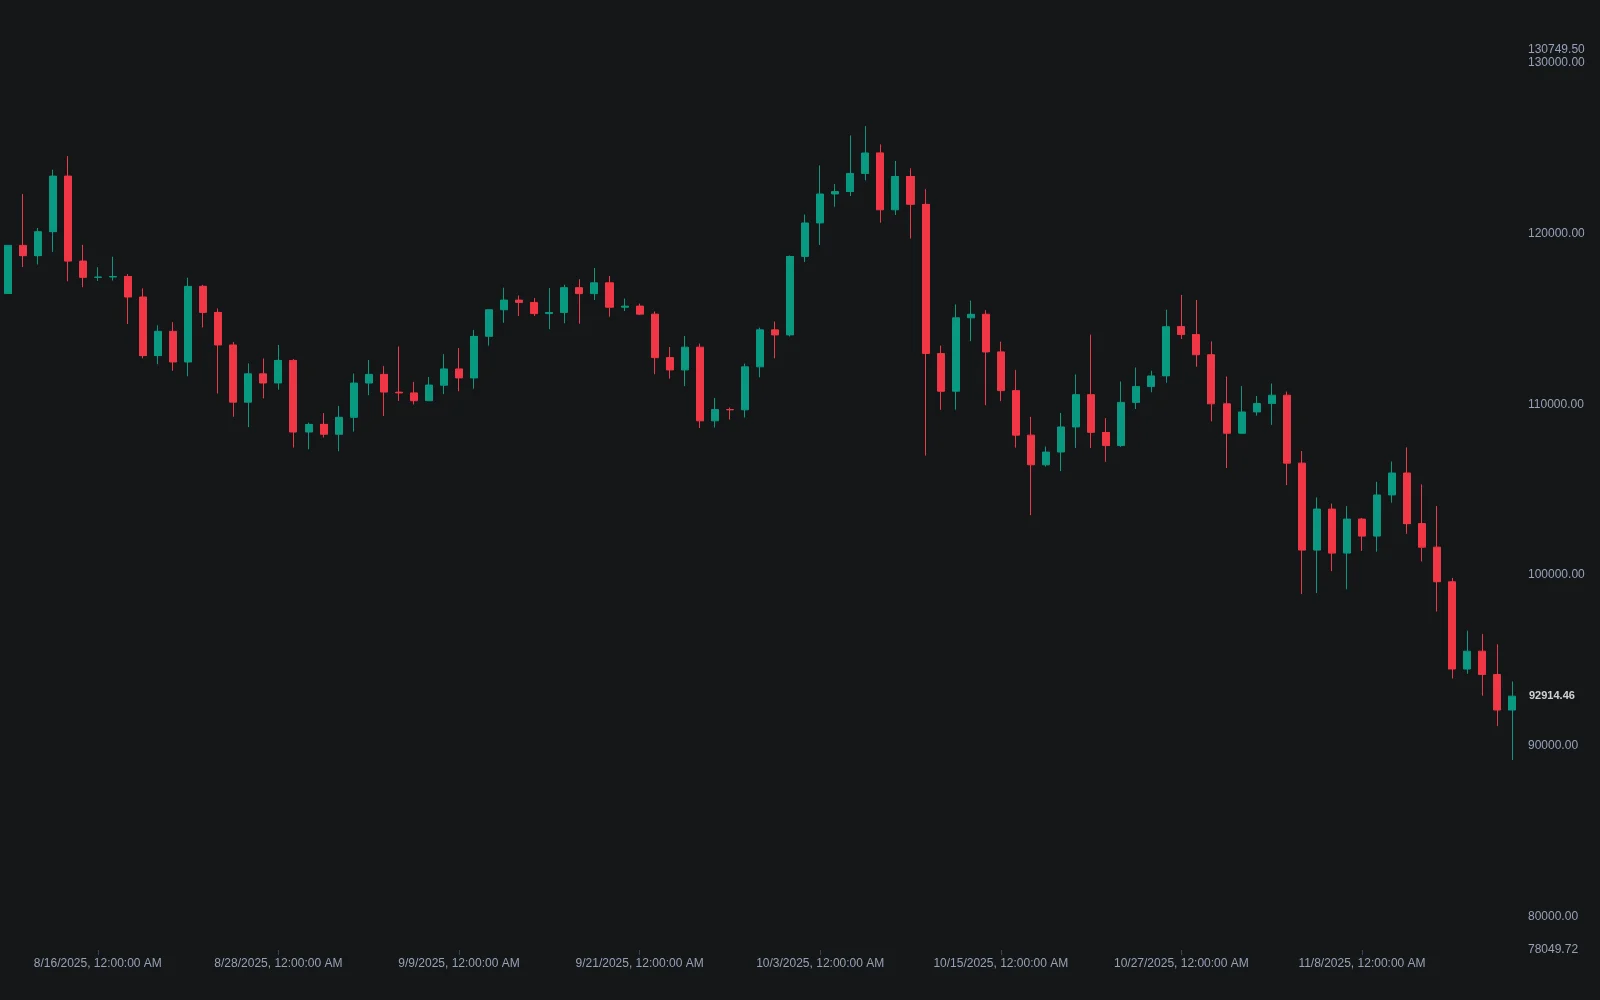
The Library's ZigZag is the standard raw construction: a Deviation (%) input, default 5, sets the minimum reversal from the leg extreme, and a Depth input, default 10, sets the minimum number of bars between consecutive pivots so the line cannot flicker on choppy charts even when the percentage is met. Two alerts, New Swing High and New Swing Low, fire on the confirmation bar rather than at the extreme, which is the honest moment to act on. The source is published on the page and it opens on Quant Charts from the page.
Several native tools build on the same swing idea. Zig Zag Channels detects pivots from rolling maximums and minimums over a window and wraps the legs in upper and lower extremities, with components backpainted to show when each swing was confirmed. Elliott Wave labels motive and corrective phases on a zigzag base, Harmonic Pattern Detection classifies five anchored pivots as a Bat, Gartley, Butterfly or Crab and projects the reversal zone, and Price Simplification reduces price to legs for the same reason the Zig Zag does.
| Tool | How it uses swings | Where it runs |
|---|---|---|
| ZigZag | Standard percentage-deviation zigzag with Depth spacing and confirmation alerts | Quant Charts, from the Library page |
| Zig Zag Channels | Window-based pivots with channel extremities as support and resistance references | Quant Charts, from the Library page |
| Elliott Wave | Wave labels drawn on a zigzag swing sequence | Quant Charts, from the Library page |
| Harmonic Pattern Detection | Classifies user-anchored X, A, B, C, D pivots and projects the potential reversal zone | Quant Charts, from the Library page |
How to Get Started
Open the ZigZag from its Library page with Open on Quant Charts, then adjust Deviation until the legs match the swings you would trade and raise Depth if the line flickers. Read the confirmed pivots for trend sequence and mark the levels of untouched pivots as places to expect a reaction. When you have a complete rule, describe it to Quant: the threshold and Depth, the trigger (a close or a stop order beyond the latest confirmed swing), the direction filter, the stop behind the opposite swing, the target rule and position sizing. Inspect the Code to confirm that every pivot is used only from its confirmation bar, then click Run. The Making Strategies with Quant guide shows the workflow, and the native backtest guide explains the Backtest Summary: net profit, trade count, win rate, maximum drawdown and profit factor, with commission and slippage set in the strategy properties.
Compare the rule at two or three thresholds and against a plain breakout of the same levels without the swing filter, on identical data and costs. Read trade count before return: a large threshold on daily bars produces few trades per market per year, so several markets and a long history are a reasonable minimum before drawing conclusions.
FAQs
Does the Zig Zag indicator repaint?
Yes, by design, but only the final leg. A pivot is confirmed once price reverses from the leg extreme by the full threshold, so the newest segment extends or relocates as bars arrive. Confirmed pivots earlier in the series never move. Rules and alerts should use confirmed pivots only.
What is the best percentage setting?
There is no universally correct value. Many platforms default to about 5% deviation, but a fixed percentage behaves very differently on a calm large-cap and a volatile crypto pair. Match the threshold to the swing scale you actually trade, or use an ATR multiple so it adapts to volatility, then keep it consistent.
How do Deviation and Depth work together?
A candidate pivot must clear both gates in the LuxAlgo ZigZag: the countermove has to reach the Deviation percentage, and the new pivot must sit at least Depth bars after the previous one. If the line skips swings you care about, lower Deviation; if it flickers on choppy charts, raise Depth.
Can I backtest a Zig Zag strategy?
Only with care. Using pivots where the indicator draws them, rather than at the later bar where they were confirmed, injects lookahead bias and produces unrealistically good results. Shift every pivot to its confirmation bar, then test on Quant Charts by describing the rule to Quant, inspecting the Code and clicking Run.
Is the Elliott zigzag the same as the Zig Zag indicator?
No. In Elliott wave vocabulary a zigzag is a specific 5-3-5 corrective pattern with its own rules. The indicator is a generic swing outline that filters price into legs above a threshold and has no wave meaning; wave analysts simply draw their counts on it.
How is a Zig Zag different from a Williams fractal?
A fractal confirms a pivot from a fixed five-bar shape regardless of how far price moved, so fractals can cluster and print several highs in a row. A Zig Zag filters by move size and forces strict alternation between highs and lows, so its swings are sparser and scale with the threshold you set.
References
LuxAlgo Resources
- Quant Charts
- LuxAlgo Quant
- ZigZag Indicator
- Zigzag Structure
- Zig Zag Channels
- Elliott Wave
- Harmonic Pattern Detection
- Price Simplification
- Williams Fractal
- Break of Structure
- Repaint-Safe Engineering
- Double Top and Bottom
- Fibonacci Retracement
- RSI
- MACD
- Making Strategies with Quant
- Native Backtest Guide
- Reversal Spotting Made Easy
- The Head and Shoulders Pattern
- Bat Harmonic Pattern
- Using Fibonacci Levels to Time Retracements
- Risking It Right
External Resources
Read next