Williams Fractal: Spotting Reversal in Trends
A Williams fractal is a five-bar swing marker: an up fractal prints on a bar whose high is higher than the highs of the two bars on each side, and a down fractal prints on a bar whose low is lower than the two lows on each side. Bill Williams popularized the pattern in his 1995 book Trading Chaos, and it remains one of the simplest objective definitions of a swing high or swing low. Because the two right-hand bars must close first, a fractal is only known two bars after the extreme printed. It confirms a turning point in the past; it does not predict the next one.
Key Takeaways
- How it works: a local extreme over five bars, marked with a small triangle above an up fractal or below a down fractal. A single bar can be both.
- Lag: confirmation arrives two bars after the extreme at the default setting, so the marker always appears behind the live edge.
- Frequency: a two-bar flank is a low hurdle, so fractals print often. Williams filtered them with his Alligator and traded only breakouts in the trend’s direction.
- Uses: breakout triggers beyond the latest fractal, trailing stops behind newly confirmed fractals, and the swing vocabulary that market-structure tools are built on.
Challenges
- Not a reversal signal: an up fractal marks where a rally paused, not whether the trend has changed. In a strong uptrend most up fractals are followed by higher highs.
- Delayed entries: by the time a fractal is confirmed, price may have moved well past it.
- Noise on short intervals: dense markers on intraday charts dilute the meaning of any single one.
Best Practices
Treat fractals as objective swing points and add the trading decision separately: a directional filter such as the Alligator or a moving average slope, a trigger such as a break beyond the fractal level, and a stop behind the opposite fractal. The LuxAlgo Williams Fractal in the Library opens on Quant Charts in one click, and Quant, our coding agent, can help turn a fractal rule into a strategy you can inspect in Code and run with Run.
Bottom line: the fractal supplies the swing points. Everything else about a trade still has to be defined and tested.
Fractals Explained – Price Structure
Project Trade published this explainer in November 2021. It covers how fractal swing points describe price structure. Treat any trade examples as illustrations of the reading rather than evidence about results.
How the Williams Fractal Indicator Works
The indicator scans completed bars for local extremes. It does not measure momentum, volume or sentiment; it applies one geometric test to highs and lows and marks the bars that pass. That mechanical simplicity is the whole appeal: no drawing, no judgment, and the same answer on every chart.
The Fractal Pattern Structure
Take a candidate bar plus the two bars before it and the two after it. If the candidate’s high is above all four neighboring highs, it is an up fractal, a confirmed swing high. If the candidate’s low is below all four neighboring lows, it is a down fractal, a confirmed swing low. The standard build requires strict inequality against every neighbor; some variants accept a tie on the older side.
| Bar | Hypothetical high | Test for an up fractal at bar 3 |
|---|---|---|
| 1 | $50.10 | Below $51.20: passes |
| 2 | $50.80 | Below $51.20: passes |
| 3 (candidate) | $51.20 | Highest of the five |
| 4 | $50.95 | Below $51.20: passes |
| 5 | $50.40 | Below $51.20: passes; the fractal is confirmed when this bar closes |
The marker is drawn on bar 3 but can only be drawn once bar 5 has closed. If bar 5 had printed a high of $51.30 instead, there would be no fractal at bar 3 and the search would move on. Nothing about the pattern says what bar 6 will do.
Calculation Method and Parameters
The only functional input is the number of bars required on each side of the extreme. Bill Williams’ definition uses two, which gives the five-bar pattern. The LuxAlgo build exposes this as Periods, default 2 with a minimum of 2, and draws the markers offset back to the fractal bar once confirmation arrives. Raising Periods produces fewer, more significant swings that confirm proportionally later; the Library describes this trade-off as pivot strength, of which a standard fractal is the strength-2 case.
| Periods | Pattern width | Confirmation lag | Character |
|---|---|---|---|
| 2 (default) | 5 bars | 2 bars | Classic Williams fractal; frequent markers |
| 3 | 7 bars | 3 bars | Fewer swings, later confirmation |
| 5 | 11 bars | 5 bars | Major swings only; on a daily chart, a week of delay |
Because the flank count sets both the swing size and the delay, there is no best value. The setting chooses which swings you work with, and a rule tested at one Periods value has not been tested at another.
Common Interpretation Problems
The most common misreading is treating a fractal as a reversal forecast. A down fractal says that a low was flanked by higher lows for two bars; in a downtrend that happens repeatedly on the way to lower lows. The pattern identifies structure, and structure only becomes a trend change when a later rule, such as a break of the opposite fractal, says so.
The second is forgetting the lag. A marker that appears two bars late is not repainting; it is the earliest moment the definition can be satisfied. Any fractal suggested on the live bar is provisional and can vanish. Honestly coded fractals are fixed once their right-hand bars close, which is why they suit backtesting, but the price has often moved by the time the marker prints.
The third is density. On a five-minute chart a two-bar flank produces markers every few bars, and most of them mark nothing that matters at the trader’s horizon. Widening Periods, moving to a higher timeframe or filtering by trend reduces the count; none of those changes the definition, only which fractals are considered.
Trading Strategies Using the Williams Fractal
Fractals become tradable when a rule is attached to them. Williams’ own rule was a stop order placed just beyond the most recent fractal, taken only when the fractal sat on the correct side of his Alligator, with signals on the wrong side ignored. TradingView’s help page describes the same approach: a breakout is indicated when price moves at least one point beyond the previous fractal’s level.
Finding Reversal Zones
Fractal highs and lows are where stops tend to rest, so untouched fractals are natural places to expect a reaction and natural targets for a move in the other direction. Whether a fractal near a support or resistance level “means more” is a hypothesis about confluence rather than a property of the pattern; write the rule down and test it before treating the alignment as confirmation.
Timeframe changes what a fractal represents. A weekly down fractal marks a low that held for two weeks on either side; a five-minute down fractal marks ten minutes of higher lows. Neither is more true than the other, but they belong to different trading horizons, and a filter taken from one timeframe applied to entries on another needs to be tested as a single rule.
Setting Stop-Loss and Take-Profit Levels
Fractals give the stop an objective home. A long entered on a break above an up fractal can carry its stop below the most recent down fractal, and as new down fractals confirm at higher lows the stop steps up behind them, a mechanical form of the structure stop. Consider a hypothetical stock with an up fractal high at $52.40 and the latest down fractal low at $49.90, traded with a $25,000 account and a 1% risk budget. See Risking It Right for the budgeting logic.
| Scenario | Calculation | Outcome before costs |
|---|---|---|
| Buy stop one cent above the fractal high | Entry $52.41; stop $49.90; $2.51 risk per share; $250 ÷ $2.51, rounded down | 99 shares; $248.49 planned risk; $5,188.59 notional |
| New down fractal confirms at $53.10 | Stop steps to $53.10; 99 × ($53.10 − $52.41) | $68.31 locked in, about 0.27R, if the stop is later hit |
| Gap through the stop, fill at $49.60 | 99 × ($52.41 − $49.60) | $278.19 loss, about 1.12R; a stop level is not a guaranteed fill |
| Periods raised to 3 | Fewer, wider swings; the down fractal used as the stop is typically farther away | Smaller position for the same $250 budget |
A fractal-to-fractal target, the next confirmed fractal in the opposite direction, is a reasonable objective in ranges, where price oscillates between marked highs and lows. In trends it caps the winner early. Whichever target rule is used, include it in the test rather than applying it by hand, and keep the same fixed fraction of capital at risk on every trade.
Combining Fractals with Other Indicators
- Alligator: Williams’ own filter. Three smoothed averages of median price, 13, 8 and 5 periods shifted forward; buy fractals are taken above the Teeth and sell fractals below, with the entangled state read as a range to stay out of. The Williams Alligator is available in the Library.
- Moving average slope: a simpler directional gate. Take up-fractal breakouts only while a chosen average is rising, and the mirror image for shorts.
- Market structure: fractals are the swing points that break of structure and change of character labels are evaluated against. The Library’s Market Structure CHoCH/BOS (Fractal) builds those labels from fractal patterns directly.
- Momentum: an oscillator reading at a fractal is a separate piece of evidence, not confirmation of the fractal. Test the combined rule as one rule.
Each added condition reduces the number of trades and adds a parameter fitted to the same history. That can improve a rule or merely make it look better in the sample; only a comparison with and without the filter, on identical data and costs, tells you which.
Using Williams Fractals with LuxAlgo
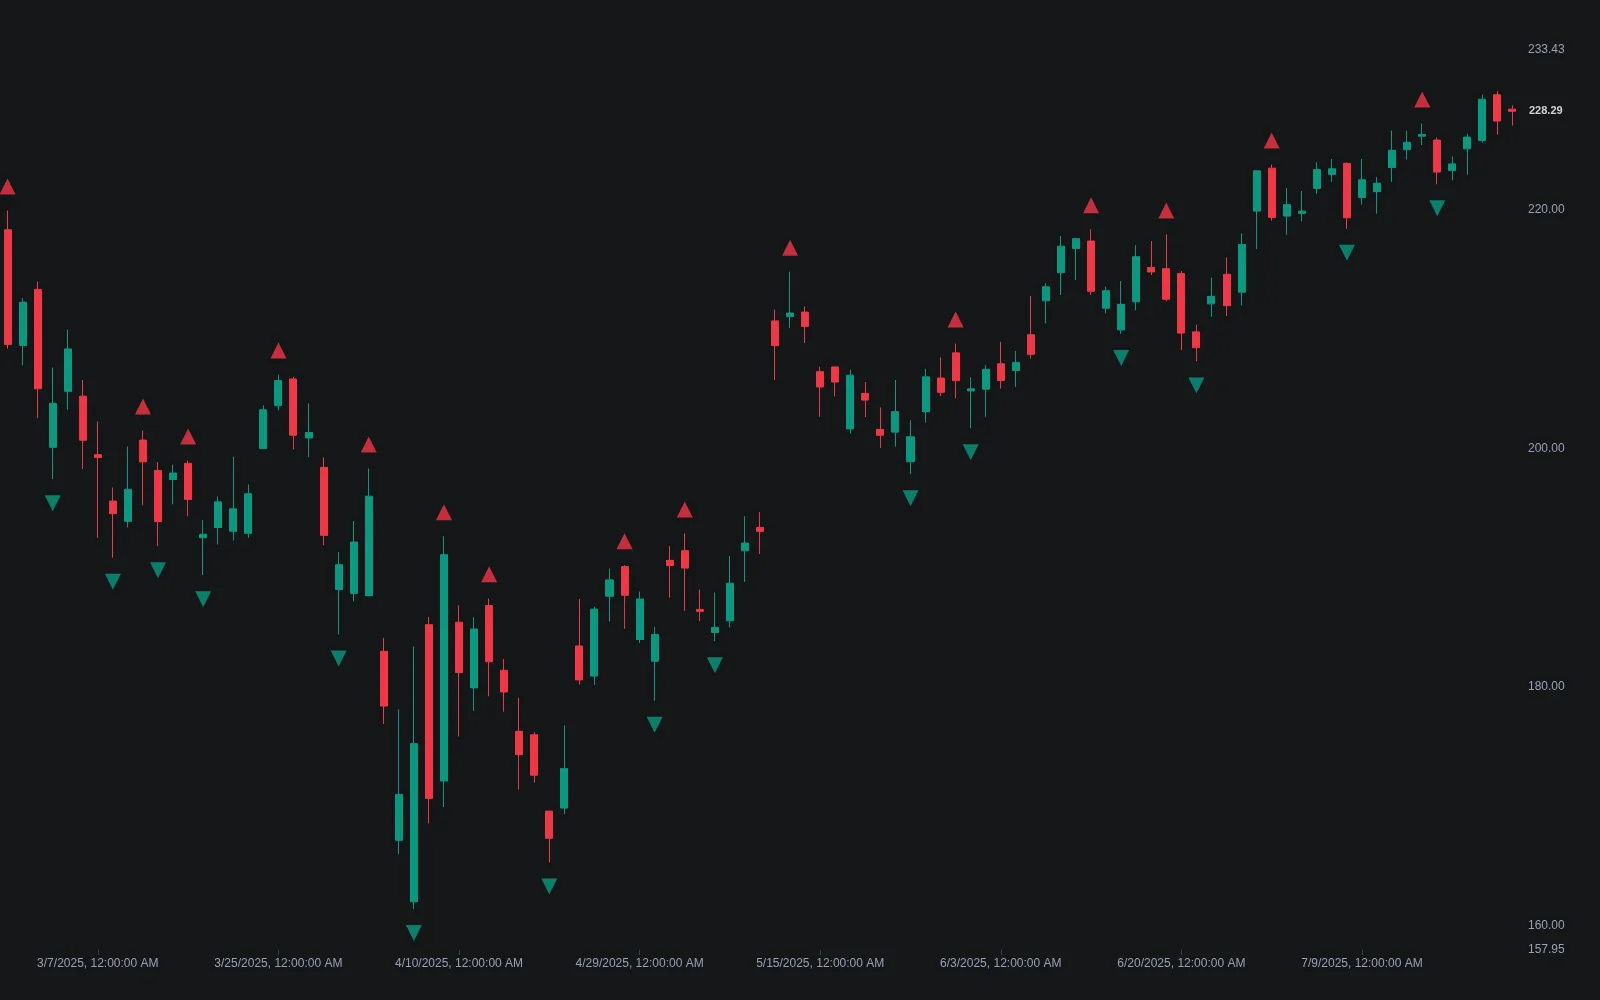
The Library’s Williams Fractal is the plain, standard build: strict inequality, Periods default 2, markers drawn at the fractal bar once confirmed, and two alert conditions, Up Fractal Confirmed and Down Fractal Confirmed, which fire at the confirmation moment rather than at the extreme. Its source is published on the page.
Fractal Features Available on LuxAlgo
| Tool | What it does with fractals | Where it runs |
|---|---|---|
| Williams Fractal | Marks confirmed up and down fractals; Periods input; confirmation alerts | Quant Charts, from the Library page |
| Market Structure CHoCH/BOS (Fractal) | Builds change-of-character and break-of-structure labels from fractal swings, with optional support and resistance levels and a dashboard | Quant Charts, from the Library page |
| Williams Alligator | The 13/8/5 displaced smoothed averages Williams used as the trend filter for fractal breakouts | Quant Charts, from the Library page |
A structure label from another tool landing near a fractal is a coincidence until a test says otherwise. No LuxAlgo tool raises the accuracy of a fractal signal by itself; what the platform offers is the means to define and test the complete rule.
Backtesting a Fractal Rule
Write the rule completely: Periods, the trigger (a close beyond the fractal level or a stop order one tick beyond it), the filter, the stop placement, the target or trailing rule, and position sizing. Describe it to Quant, inspect the Code to confirm the fractal is evaluated only after its right-hand bars close, and click Run. The Making Strategies with Quant guide shows the workflow, and the native backtest guide explains the Backtest Summary: net profit, trade count, win rate, maximum drawdown and profit factor, with commission and slippage set in the strategy properties.
Compare the filtered rule with the unfiltered one and with a plain breakout of the same levels without fractal confirmation. Read trade count before return; a five-bar pattern on daily bars produces a modest number of trades per market per year, so several markets and a decade of history are a reasonable minimum.
Documentation and the Library
The Williams fractal concept page gives the definition, formula, tie-handling conventions and the fractal chaos bands and oscillator variants, with links to the related swing high and low and pivot strength concepts. When adapting a shared fractal setting, record the Periods value, the trigger convention and the interval; without those a result cannot be reproduced.
Pros and Cons of the Williams Fractal Indicator
Benefits of the Williams Fractal
The definition is mechanical and public, so every trader and every tool marks the same bars. Confirmed fractals do not repaint, which makes them dependable inputs for backtests and for structure logic. The pattern applies unchanged to any market and interval because it reads only highs and lows, and it gives stops and targets an objective anchor without any drawing.
Drawbacks and Best Practices
The two-bar lag is the price of objectivity: the marker is always late relative to the extreme, and on fast markets the move may be largely over by confirmation. The pattern is also indiscriminate, marking trivial pauses as readily as important turns, so a filter is part of any workable rule. Neither drawback is a flaw in the indicator; both follow from what it is, a swing detector rather than a signal generator.
Comparison: Standalone Fractal vs. a Complete Rule
| Question | Standalone fractal | Fractal inside a tested rule |
|---|---|---|
| What does a marker mean? | A confirmed local extreme | A level for a defined trigger, stop or target |
| Direction | None; up and down fractals print in every trend | Supplied by a filter such as the Alligator or an average slope |
| Entry timing | Two bars after the extreme, with no order defined | A stop or close beyond the level, defined in advance |
| Risk | Not addressed | Stop behind the opposite fractal; size from the distance |
| Evidence | Anecdotal | Backtest Summary with costs, compared with the unfiltered rule |
Conclusion
The Williams fractal is a small, exact idea: a five-bar local extreme confirmed two bars late. It gives structure a vocabulary and gives stops and triggers an objective anchor, and that is where its value ends. Direction, timing, size and evidence all come from the rule built around it.
Quant Charts provides the standard fractal, the Alligator that Williams used to filter it and a fractal-based structure tool natively, and Quant can help turn a written fractal rule into a backtest you can inspect and run. Whatever the test shows, the fractal will still mark the same bars; the question is whether your rule around them earns its place.
FAQs
Do Williams fractals repaint?
No, but they lag. A fractal cannot be evaluated until the two bars to its right have closed, so markers appear two bars after the extreme and are fixed once drawn. Anything suggested on the live bar is provisional and can disappear.
Is an up fractal a sell signal?
No. It marks a confirmed swing high, and in an uptrend most swing highs are followed by higher highs. Williams traded fractals as breakouts in the trend’s direction, filtered by the Alligator, not as reversal signals.
What is the best Periods setting?
The classic definition uses two bars on each side and has no other setting. Wider values give fewer, more significant swings that confirm later. No value is best across markets; the setting chooses the swing size you work with.
How did Bill Williams trade fractals?
With a stop order placed just beyond the most recent fractal, taken only when that fractal sat on the correct side of the Alligator’s Teeth, and with opposing signals ignored. The fractal supplied the level; the Alligator supplied the direction.
How do fractals differ from a zig zag indicator?
A fractal is pure local bar geometry and marks any qualifying five-bar extreme however small. A zig zag admits only reversals beyond a size threshold and never marks two highs or two lows in a row, so its swings are sparser and more selective.
Can I backtest a fractal strategy on Quant Charts?
Yes. Open the Williams Fractal from the Library with Open on Quant Charts, describe the full rule to Quant including Periods, trigger, filter, stop and sizing, inspect the Code and click Run. Compare the result with the unfiltered rule under the same costs.
References
LuxAlgo Resources
- Quant Charts
- LuxAlgo Quant
- Williams Fractal Indicator
- Williams Fractal Concept
- Williams Alligator Indicator
- Alligator Concept
- Market Structure CHoCH/BOS (Fractal)
- Pivot Strength
- Structure Stop
- Break of Structure
- Change of Character
- Swing High and Low
- Making Strategies with Quant
- Native Backtest Guide
- Understanding Moving Averages
- Risking It Right
External Resources
Read next