
Learn how to use the Supertrend indicator to identify trends, spot trade entries, and optimize your trading strategy step by step.
The Supertrend indicator is celebrated for its simplicity and effectiveness in identifying market trends and providing clear signals for trade entries or exits. Yet, many traders misuse it, limiting its potential to enhance trading strategies. In this article, we’ll break down how to use the Supertrend indicator correctly, dive into its underlying mechanics, and explore its role within a broader technical analysis framework.
Whether you're trading stocks, forex, or cryptocurrencies, understanding the nuances of the Supertrend indicator can help you move beyond reactive trading and towards a more disciplined, data-driven approach.
What Is the Supertrend Indicator?
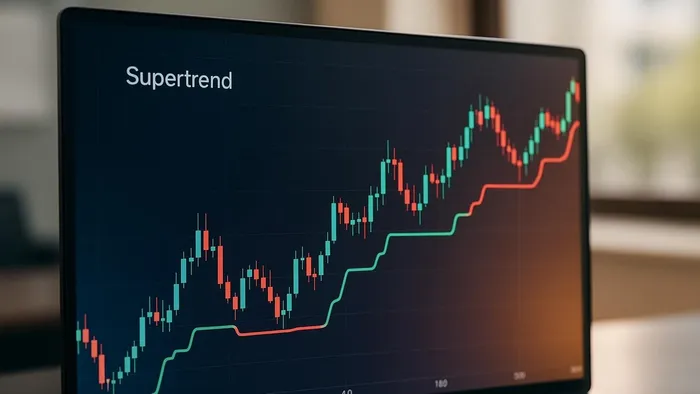
The Supertrend is a trend-following technical analysis tool that overlays directly on your price chart, using color-coded signals to indicate bullish (green) or bearish (red) trends. It adapts to price action and market volatility in real time, acting as both a trend filter and a dynamic stop-loss level.
Unlike static indicators, Supertrend is highly responsive to changing market conditions, making it ideal for traders who want immediate, visual confirmation of market direction. Despite its apparent simplicity, the indicator relies on a calculation involving the Average True Range (ATR), a key measure of market volatility.
Key Features of the Supertrend Indicator
To fully harness the power of Supertrend, it’s important to understand its key components:
1. ATR Length and Factor
- ATR Length: The number of periods (e.g., 10 candles) used to calculate the Average True Range, which measures market volatility.
- Factor: A multiplier applied to the ATR to determine how far the Supertrend line sits from the price.
By default, the ATR Length is set to 10, and the Factor is 3. These parameters can be customized to suit your trading style and risk tolerance. If you prefer extended trends and fewer flips, consider pairing Supertrend with LuxAlgo Signals & Overlays™ signal modes for added confirmation, or explore adaptive approaches like SuperTrend AI (Clustering) to auto-select robust factor ranges.
2. Dynamic Adaptation to Volatility
The Supertrend adjusts its position based on volatility changes. In quieter markets, it stays closer to the price, providing tighter stop levels. In more volatile conditions, it moves further away, reducing the likelihood of false signals from minor price fluctuations. For broader market context, consider trend-strength and money-flow readings from LuxAlgo’s Oscillator Matrix™.
3. Trend Determination
The position of the Supertrend line relative to the price determines the trend:
- Bullish Trend: The line is below the price and green.
- Bearish Trend: The line is above the price and red.
The trend only flips when the market price crosses the Supertrend level, helping traders identify potential trend reversals. If you want a prebuilt overview of how Supertrend-style logic behaves over time, review LuxAlgo’s SuperTrend Oscillator for additional context on false-signal filtering.
How to Configure the Supertrend Indicator
To get started with the Supertrend indicator on platforms like TradingView, follow these steps:
Step 1: Add the Supertrend to Your Chart
- Open the Indicators menu on your trading platform.
- Search for “Supertrend” and select the version under the “Technicals” category. On TradingView, you can also explore LuxAlgo’s free Library entries like SuperTrend AI (Clustering) to compare variants.
Step 2: Adjust Settings for Precision
Navigate to the gear icon next to the indicator name to access its settings. Here’s what to focus on:
-
Inputs Tab:
- Adjust the ATR Length and Factor to control sensitivity. Smaller values make the indicator more responsive but risk more false signals.
- Enable “Wait for timeframe closes” to ensure signals are only confirmed after a candle closes.
-
Style Tab:
- Customize the colors and thickness of the lines for bullish and bearish trends.
- Enable background shading to visually emphasize trends. When using LuxAlgo toolkits, see the Signals & Overlays docs for style and display options.
-
Visibility Tab:
- Control which timeframes display the indicator (e.g., intraday or daily charts).
By fine-tuning these settings, you can adapt the Supertrend to align with your trading strategy and market conditions.
The Math: How Supertrend Works
Understanding the calculation behind the Supertrend provides deeper insight into its signals and reliability. Here’s a simplified breakdown:
1. Average True Range (ATR)
The ATR measures recent market volatility over a user-defined period (default: 10). It acts as the foundation for the Supertrend’s sensitivity to price movements. If you’re exploring volatility further, pair ATR with dispersion tools or consult exchange education on volatility; as a primer, see the concise overview on ATR fundamentals.
2. Basic Upper and Lower Bands
These bands are calculated using the midpoint of the high and low prices (HL2) and adjusted by the ATR multiplier:
- Basic Upper Band: HL2 + (Factor × ATR)
- Basic Lower Band: HL2 − (Factor × ATR)
3. Final Bands and Trend Filtering
- If the previous close is above the prior Supertrend line, the Final Upper Band is adjusted upward.
- Conversely, if the previous close is below the Supertrend line, the Final Lower Band is adjusted downward.
- This filtering process reduces noise, ensuring that minor fluctuations don’t trigger premature trend reversals.
4. Trend Direction
- Uptrend: The current close is above the Final Lower Band.
- Downtrend: The current close is below the Final Upper Band.
This calculated sequence allows Supertrend to dynamically reflect changes in market momentum and volatility.
Avoiding the Biggest Pitfall: Misuse as a Standalone Signal
One of the most common mistakes traders make is treating the Supertrend as an automatic buy or sell signal. This leads to poor trades based on superficial color changes, without considering market context.
Key Misconceptions to Avoid:
- Chasing Signals: Entering trades solely because the line changes color.
- Ignoring Context: Overlooking broader trends, price structure, and volatility levels.
A Smarter Approach
The Supertrend should be viewed as a trend filter—a way to confirm whether you’re trading in alignment with market momentum. Supplement it with price structure from Price Action Concepts (PAC), dynamic signals from Signals & Overlays (S&O), and trend/flow insights from Oscillator Matrix (OSC). For volatility-based context, pairing Supertrend with Bollinger Bands can help separate real breakouts from noise.
Practical Applications of the Supertrend
1. Trend Confirmation
Combine the Supertrend with price action to confirm market direction before entering a trade. For example:
- Use it alongside moving averages to validate bullish or bearish sentiment (moving average overview).
- Check for rejection or pullbacks near the Supertrend line to assess trend strength. If you prefer automation, LuxAlgo provides Signals & Overlays with configurable confirmations.
2. Dynamic Stop-Loss Placement
The Supertrend can serve as a dynamic stop-loss level, helping traders lock in profits and reduce risk. In a bullish trend, place your stop just below the green Supertrend line, and vice versa for bearish trends. For a deeper walkthrough using trailing logic, see LuxAlgo’s Supertrend trailing-stop guide.
3. Filter for Breakouts
Use the Supertrend in conjunction with volatility-based indicators like Bollinger Bands to differentiate between genuine breakouts and false moves. You can also scan structure-based opportunities with the PAC Screener or validate rules historically in the PAC Backtester. For TradingView access, see PAC Screener (TradingView) and PAC Backtester (TradingView).
Insights from Trading Psychology
No indicator, including the Supertrend, guarantees success on a trade-by-trade basis. According to Mark Douglas, a renowned figure in trading psychology, traders often fail because they expect certainty from their tools. Instead, focus on probabilities over a series of trades, understanding that market outcomes are shaped by collective buying and selling pressures, not by mathematical predictions. For a concise primer on expectations and risk, see this educational overview of trading psychology principles.
As Douglas emphasizes:
“Technical methodologies don’t tell you what’s going to happen next on a trade-by-trade basis. They will tell you what will happen over a series of trades on a percentage basis.”
This mindset shift is crucial for disciplined trading and sustainable success.
Key Takeaways
- Supertrend is a Trend Filter: Its primary role is to help traders align their positions with the prevailing market momentum. For additional confluence, consider Signals & Overlays or Price Action Concepts.
- Customization Matters: Adjusting ATR Length and Factor parameters allows you to fine-tune the indicator’s sensitivity. Adaptive variants like SuperTrend AI (Clustering) can help.
- Avoid Misuse: Don’t use the Supertrend as a standalone buy or sell signal. Pair it with broader analysis and, when relevant, confirm with Oscillator Matrix components.
- Understand the Math: Knowing how the ATR and bands are calculated gives you greater confidence in the indicator’s reliability.
- Focus on Context: Combine the Supertrend with other tools like price action, volume, or moving averages for more robust strategies. You can prototype and iterate rules quickly with LuxAlgo’s AI Backtesting (our AI agent for creating trading strategies on the web).
- Use as a Stop-Loss Tool: The dynamic lines can act as flexible stop-loss levels that adapt to market volatility.
- Mindset Over Magic: Indicators are guidance, not certainty—success depends on disciplined execution over a series of trades.
Conclusion
The Supertrend indicator is a versatile resource that offers valuable insights into market trends and volatility. However, its true power lies in how you use it—understanding its mechanics, combining it with other strategies, and maintaining a disciplined mindset will set you apart as a trader.
By embracing these principles, you can transform the Supertrend from just another indicator into an integral part of your trading process. If you’d like to build and test rules that blend Supertrend logic with structure, signals, and money flow, try LuxAlgo’s AI Backtesting. Happy trading!
Source: “Supertrend Indicator Explained Step by Step (TradingView Tutorial)” — Com Lucro Trader, YouTube, Aug 27, 2025 — Watch on YouTube
Use: Embedded for reference. Brief quotes used for commentary/review.
References
LuxAlgo Resources
- Signals & Overlays™ — TradingView
- Oscillator Matrix — TradingView
- SuperTrend Oscillator — Overview
- SuperTrend AI (Clustering) — Overview
- Signals & Overlays — Documentation
- Price Action Concepts — Documentation
- Oscillator Matrix — Documentation
- Signals & Overlays — Overview
- Price Action Concepts — Overview
- PAC Screener — Overview
- PAC Screener — TradingView
- PAC Backtester — Overview
- PAC Backtester — TradingView
- AI Backtesting Assistant — Main Page
- Supertrend Trailing-Stop Strategy — Blog Guide


